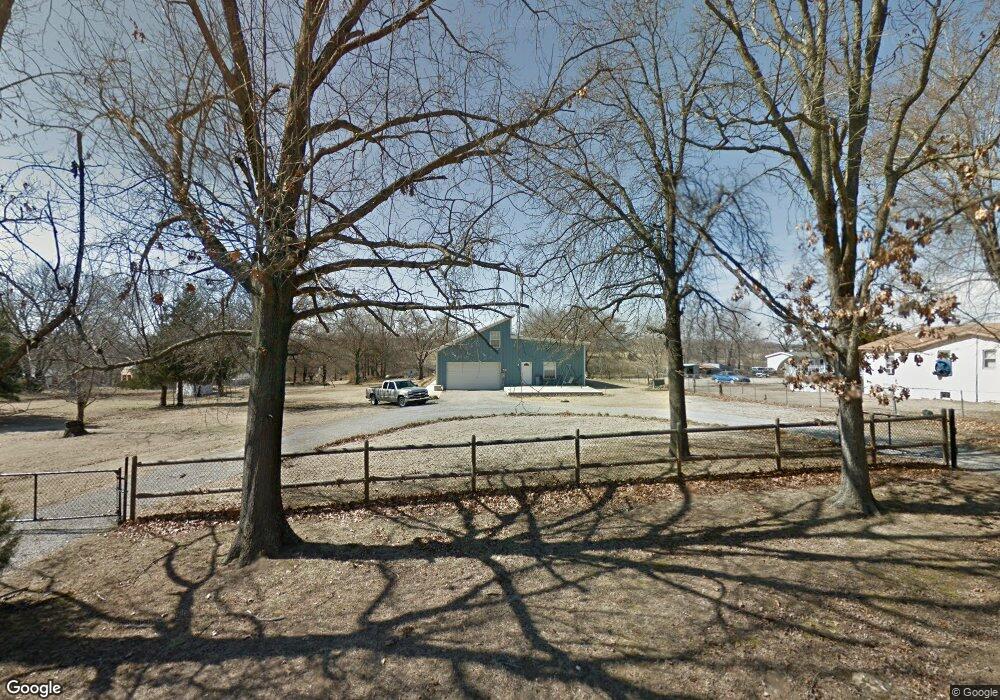
17800 S 4170 Rd Claremore, OK 74017
Estimated Value: $294,000 - $375,000
3
Beds
2
Baths
2,446
Sq Ft
$139/Sq Ft
Est. Value
About This Home
This home is located at 17800 S 4170 Rd, Claremore, OK 74017 and is currently estimated at $339,171, approximately $138 per square foot. 17800 S 4170 Rd is a home with nearby schools including Sequoyah Elementary School, Sequoyah High School, and Claremore Christian School.
Ownership History
Date
Name
Owned For
Owner Type
Purchase Details
Closed on
Jan 7, 2021
Sold by
Stone Jimmy L and Stone Vera F
Bought by
Stone Jimmy L and Stone Vera F
Current Estimated Value
Home Financials for this Owner
Home Financials are based on the most recent Mortgage that was taken out on this home.
Original Mortgage
$50,000
Outstanding Balance
$40,450
Interest Rate
2.71%
Mortgage Type
Credit Line Revolving
Estimated Equity
$298,721
Purchase Details
Closed on
Jul 20, 2008
Sold by
Stone Jimmy L and Stone Vera F
Bought by
Stone Jimmy L and Stone Vera F
Create a Home Valuation Report for This Property
The Home Valuation Report is an in-depth analysis detailing your home's value as well as a comparison with similar homes in the area
Home Values in the Area
Average Home Value in this Area
Purchase History
| Date | Buyer | Sale Price | Title Company |
|---|---|---|---|
| Stone Jimmy L | -- | American Eagle Title Ins Co | |
| Stone Jimmy L | -- | Integrity Ttl & Closing | |
| Stone Jimmy L | -- | None Available |
Source: Public Records
Mortgage History
| Date | Status | Borrower | Loan Amount |
|---|---|---|---|
| Open | Stone Jimmy L | $50,000 |
Source: Public Records
Tax History Compared to Growth
Tax History
| Year | Tax Paid | Tax Assessment Tax Assessment Total Assessment is a certain percentage of the fair market value that is determined by local assessors to be the total taxable value of land and additions on the property. | Land | Improvement |
|---|---|---|---|---|
| 2025 | $2,255 | $22,902 | $4,890 | $18,012 |
| 2024 | $2,195 | $22,235 | $4,748 | $17,487 |
| 2023 | $2,195 | $21,587 | $4,516 | $17,071 |
| 2022 | $2,119 | $20,958 | $4,473 | $16,485 |
| 2021 | $1,983 | $20,958 | $4,539 | $16,419 |
| 2020 | $1,985 | $20,348 | $4,444 | $15,904 |
| 2019 | $1,782 | $18,051 | $3,993 | $14,058 |
| 2018 | $1,793 | $18,516 | $3,992 | $14,524 |
| 2017 | $1,697 | $17,454 | $3,984 | $13,470 |
| 2016 | $1,656 | $16,945 | $3,979 | $12,966 |
| 2015 | $1,607 | $16,452 | $3,973 | $12,479 |
| 2014 | $1,569 | $15,972 | $3,965 | $12,007 |
Source: Public Records
Map
Nearby Homes
- 17090 S 4170 Rd
- 14800 Cedar Dr
- 13414 E 463 Rd
- 17995 S 4160 Rd
- 17791 S 4180 Rd
- 2701 Spring Creek St
- 18774 S Birch Hollow Way
- 18954 S Hisaw Dr
- 9251 E 470 Rd
- 18723 S 4185 Rd Unit A
- E E 470 Rd
- 19434 S Quail Run Ct
- 18870 Timberlake
- 17135 S Creekwood Ct
- 19805 S Lake Dr
- 17811 S 4150 Rd
- 531 Buckingham Dr
- 1921 Bristol Rd
- 11971 Stonehedge Dr
- 11901 Laurel Ln
- 17770 S 4170 Rd
- 17820 S 4170 Rd
- 4213 Reed Rd
- 17840 S 4170 Rd
- 13831 E 460 Rd
- 17890 S 4170 Rd
- 17910 S 4170 Rd
- 13825 E 460 Rd
- 17864 S 4168 Rd
- 17904 S 4168 Rd
- 17901 S Highway 66
- 17944 S 4168 Rd
- 13838 E 460 Rd
- 12500 NE Bernie Rd
- 12000 NE Bernie Rd
- 13812 E 460 Rd
- 11900 E 460 Rd
- 11704 NE Bernie Rd
- 0 NE Bernie Rd Unit 221872
- 0 NE Bernie Rd Unit 2026394