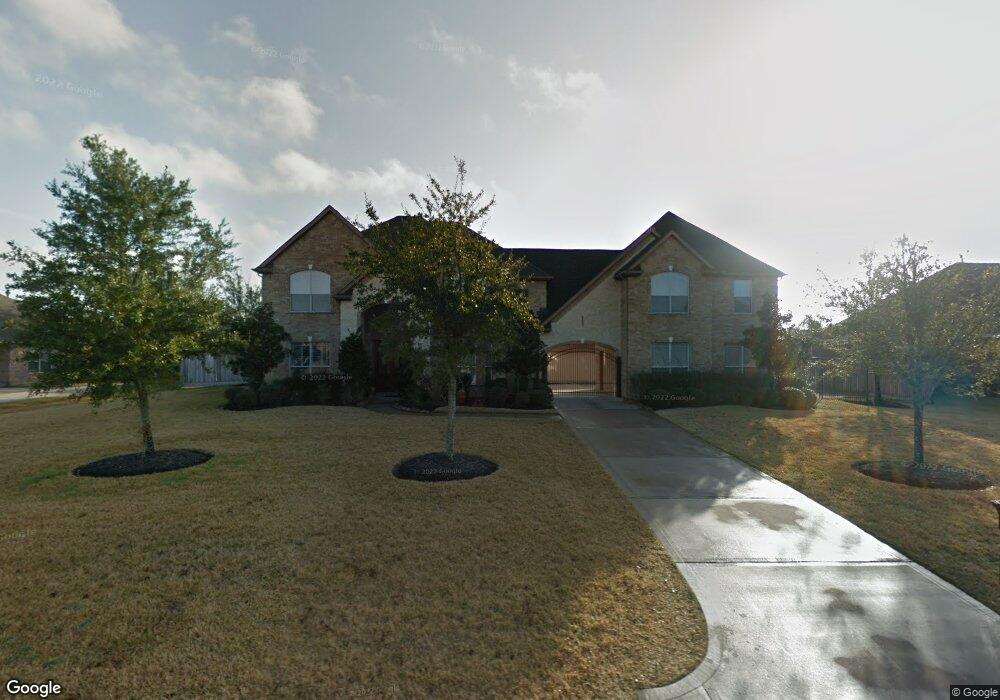
17806 Fairhaven Lake Dr Cypress, TX 77433
Estimated Value: $1,062,000 - $1,209,000
6
Beds
7
Baths
5,513
Sq Ft
$202/Sq Ft
Est. Value
About This Home
This home is located at 17806 Fairhaven Lake Dr, Cypress, TX 77433 and is currently estimated at $1,114,950, approximately $202 per square foot. 17806 Fairhaven Lake Dr is a home located in Harris County with nearby schools including Swenke Elementary School, Salyards Middle, and Bridgeland High School.
Ownership History
Date
Name
Owned For
Owner Type
Purchase Details
Closed on
Dec 20, 2018
Sold by
Spradley Land Llc
Bought by
Pak American Traders International Llc
Current Estimated Value
Home Financials for this Owner
Home Financials are based on the most recent Mortgage that was taken out on this home.
Original Mortgage
$560,000
Interest Rate
4.9%
Mortgage Type
Purchase Money Mortgage
Purchase Details
Closed on
Nov 21, 2008
Sold by
Trendmaker Homes Inc
Bought by
Ahmad Aftab Syed and Ahmad Asma Aftab
Home Financials for this Owner
Home Financials are based on the most recent Mortgage that was taken out on this home.
Original Mortgage
$414,412
Interest Rate
5.99%
Mortgage Type
Purchase Money Mortgage
Purchase Details
Closed on
Jun 4, 2008
Sold by
Lakes Of Fairhaven Llc
Bought by
Tmi Inc
Create a Home Valuation Report for This Property
The Home Valuation Report is an in-depth analysis detailing your home's value as well as a comparison with similar homes in the area
Home Values in the Area
Average Home Value in this Area
Purchase History
| Date | Buyer | Sale Price | Title Company |
|---|---|---|---|
| Pak American Traders International Llc | -- | Select Title Llc | |
| Ahmad Aftab Syed | -- | Chicago Title Park Ten | |
| Tmi Inc | -- | Chicago Title Park Ten |
Source: Public Records
Mortgage History
| Date | Status | Borrower | Loan Amount |
|---|---|---|---|
| Closed | Pak American Traders International Llc | $560,000 | |
| Previous Owner | Ahmad Aftab Syed | $414,412 |
Source: Public Records
Tax History Compared to Growth
Tax History
| Year | Tax Paid | Tax Assessment Tax Assessment Total Assessment is a certain percentage of the fair market value that is determined by local assessors to be the total taxable value of land and additions on the property. | Land | Improvement |
|---|---|---|---|---|
| 2025 | $12,739 | $971,526 | $145,646 | $825,880 |
| 2024 | $12,739 | $926,238 | $145,646 | $780,592 |
| 2023 | $12,739 | $835,884 | $145,646 | $690,238 |
| 2022 | $14,756 | $800,016 | $121,372 | $678,644 |
| 2021 | $14,003 | $627,460 | $121,372 | $506,088 |
| 2020 | $13,487 | $587,807 | $110,338 | $477,469 |
| 2019 | $13,211 | $554,408 | $110,338 | $444,070 |
| 2018 | $6,771 | $619,014 | $110,338 | $508,676 |
| 2017 | $14,759 | $629,903 | $110,338 | $519,565 |
| 2016 | $14,165 | $604,579 | $110,338 | $494,241 |
| 2015 | $10,132 | $604,579 | $110,338 | $494,241 |
| 2014 | $10,132 | $551,682 | $110,338 | $441,344 |
Source: Public Records
Map
Nearby Homes
- 21006 Refuge Creek Dr
- 17819 Refuge Lake Dr
- 17703 Fairhaven Lake Dr
- 12211 Bell County Ct
- 12239 Bell County Ct
- 12319 Fort Hood Ln
- 12235 Bell County Ct
- 17715 Lakeside Haven Dr
- 21315 Fairhaven Meadow Dr
- 21303 Fairhaven Creek Dr
- 20803 Fairhaven Crossing Dr
- 17711 Fairhaven Falls Dr
- 21410 Refuge Creek Dr
- 21411 Fairhaven Creek Dr
- 17310 Calico Peak Way
- 17403 Ledgefield
- 17819 Country Cove
- 21006 N Caramel Apple Trail
- 18014 Lasso Mills Dr
- 17011 Saddle Ridge Pass
- 17810 Fairhaven Lake Dr
- 17802 Fairhaven Lake Dr
- 17807 Safe Haven Dr
- 17811 Safe Haven Dr
- 17803 Fairhaven Lake Dr
- 17811 Fairhaven Lake Dr
- 17803 Safe Haven Dr
- 17710 Fairhaven Lake Dr
- 17711 Safe Haven Dr
- 21010 Refuge Creek Dr
- 21002 Refuge Creek Dr
- 17806 Safe Haven Dr
- 17810 Refuge Lake Dr
- 17802 Safe Haven Dr
- 17706 Fairhaven Lake Dr
- 17806 Refuge Lake Dr
- 17706 Fairhaven Lake Dr
- 17707 Safe Haven Dr
- 21102 Refuge Creek Dr
- 17810 Safe Haven Dr