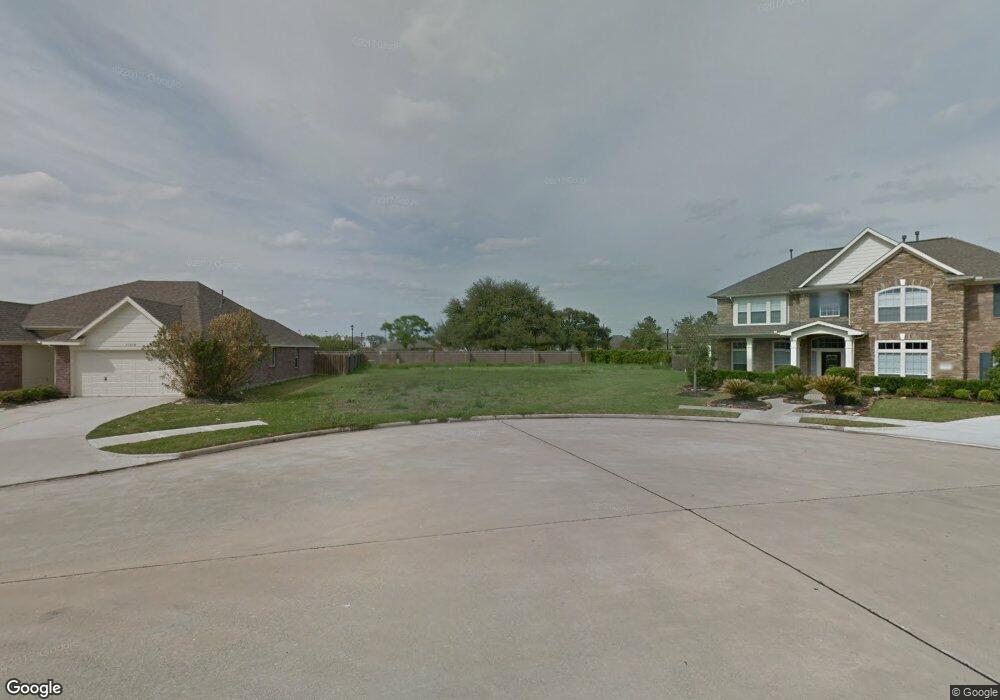
17806 Placid Oak Ct Cypress, TX 77433
Canyon Lakes West NeighborhoodEstimated Value: $327,000 - $369,000
4
Beds
3
Baths
2,203
Sq Ft
$155/Sq Ft
Est. Value
About This Home
This home is located at 17806 Placid Oak Ct, Cypress, TX 77433 and is currently estimated at $342,217, approximately $155 per square foot. 17806 Placid Oak Ct is a home located in Harris County with nearby schools including Postma Elementary School, Anthony Middle, and Cypress Springs High School.
Ownership History
Date
Name
Owned For
Owner Type
Purchase Details
Closed on
Feb 8, 2020
Sold by
Truong Peter Thanh and Tran Nguyen Nhu
Bought by
Truong Peter Thanh
Current Estimated Value
Purchase Details
Closed on
Jun 30, 2016
Sold by
Pt2 Holding Co Llc
Bought by
Truong Peter Thanh
Home Financials for this Owner
Home Financials are based on the most recent Mortgage that was taken out on this home.
Original Mortgage
$172,500
Outstanding Balance
$138,061
Interest Rate
3.66%
Mortgage Type
New Conventional
Estimated Equity
$204,156
Purchase Details
Closed on
Jun 14, 2016
Sold by
Pt 2 Holding Company Llc
Bought by
Pt2 Holding Company Llc and Wdk Holdings Llc
Home Financials for this Owner
Home Financials are based on the most recent Mortgage that was taken out on this home.
Original Mortgage
$172,500
Outstanding Balance
$138,061
Interest Rate
3.66%
Mortgage Type
New Conventional
Estimated Equity
$204,156
Purchase Details
Closed on
Dec 9, 2015
Sold by
Nxt Solutions Llc
Bought by
Pt2 Holdings Co Llc
Create a Home Valuation Report for This Property
The Home Valuation Report is an in-depth analysis detailing your home's value as well as a comparison with similar homes in the area
Home Values in the Area
Average Home Value in this Area
Purchase History
| Date | Buyer | Sale Price | Title Company |
|---|---|---|---|
| Truong Peter Thanh | -- | None Available | |
| Truong Peter Thanh | -- | None Available | |
| Pt2 Holding Company Llc | -- | None Available | |
| Pt2 Holdings Co Llc | -- | Attorney |
Source: Public Records
Mortgage History
| Date | Status | Borrower | Loan Amount |
|---|---|---|---|
| Open | Truong Peter Thanh | $172,500 |
Source: Public Records
Tax History Compared to Growth
Tax History
| Year | Tax Paid | Tax Assessment Tax Assessment Total Assessment is a certain percentage of the fair market value that is determined by local assessors to be the total taxable value of land and additions on the property. | Land | Improvement |
|---|---|---|---|---|
| 2025 | $5,040 | $346,334 | $70,525 | $275,809 |
| 2024 | $5,040 | $339,686 | $70,525 | $269,161 |
| 2023 | $5,040 | $363,051 | $70,525 | $292,526 |
| 2022 | $6,687 | $310,073 | $50,319 | $259,754 |
| 2021 | $6,443 | $252,320 | $50,319 | $202,001 |
| 2020 | $6,354 | $239,829 | $36,055 | $203,774 |
| 2019 | $6,281 | $230,000 | $29,716 | $200,284 |
| 2018 | $2,347 | $235,000 | $29,716 | $205,284 |
| 2017 | $6,656 | $239,738 | $29,716 | $210,022 |
| 2016 | $825 | $29,716 | $29,716 | $0 |
| 2015 | $854 | $29,716 | $29,716 | $0 |
| 2014 | $854 | $29,716 | $29,716 | $0 |
Source: Public Records
Map
Nearby Homes
- 8311 Brighton Lake Ln
- 8410 Brighton Lake Ln
- 17531 Cypress Laurel St
- 8535 Morning Oak Ln
- 17603 Fairgrove Park Dr
- 8215 Still Oak Ln
- 8507 Forest Arbor Ct
- 18114 Shallow Leaf Ln
- 8519 Sunrise Meadow Ln
- 7918 Blue Wahoo Ln
- 8615 Debbie Terrace Dr
- 18202 Foley Park Ct
- 7838 Blue Wahoo Ln
- 18202 Rexine Ln
- 18402 Westgate Springs Ln
- 8803 Emerald Shore Ct
- 18323 Tuscana Shores Dr
- 8823 Hollow Banks Ln
- 8211 Gran Villa Dr
- 8830 Debbie Terrace Dr
- 17810 Placid Oak Ct
- 17802 Placid Oak Ct
- 17803 Placid Oak Ct
- 17807 Placid Oak Ct
- 17811 Placid Oak Ct
- 17815 Placid Oak Ct
- 8411 Bending Branch Ln
- 8407 Bending Branch Ln
- 17806 Shadow Cypress Ct
- 17810 Shadow Cypress Ct
- 8411 Brighton Lake Ln
- 8415 Brighton Lake Ln
- 8407 Brighton Lake Ln
- 8403 Bending Branch Ln
- 17807 Woodsburgh Ln
- 17814 Shadow Cypress Ct
- 8419 Brighton Lake Ln
- 8403 Brighton Lake Ln
- 17822 Shadow Cypress Ct
- 17811 Woodsburgh Ln