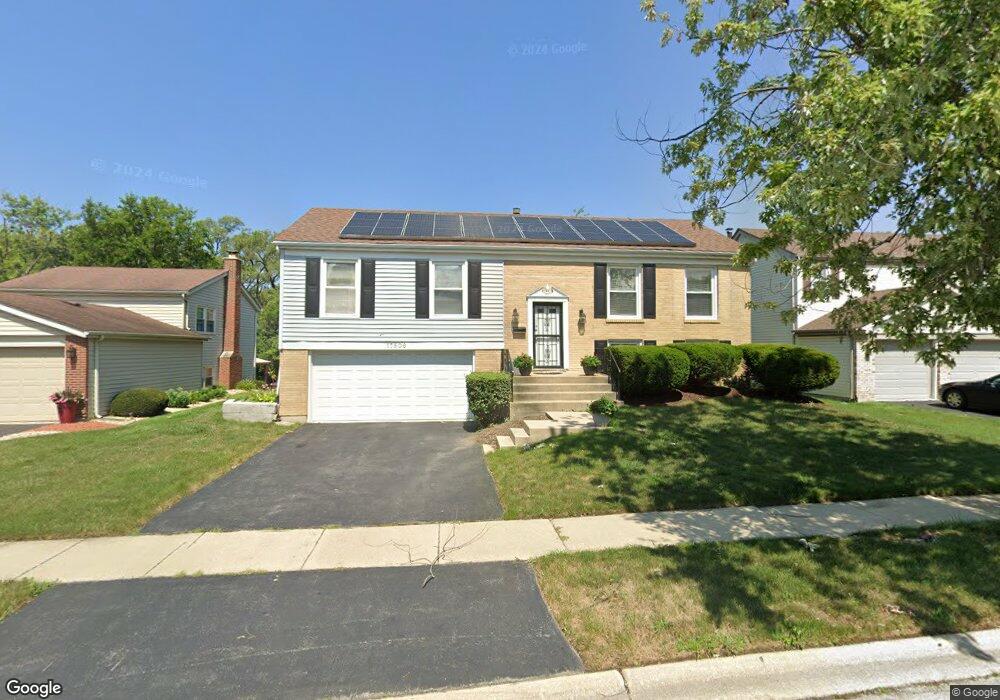
17806 Ridgewood Dr Hazel Crest, IL 60429
Stonebridge NeighborhoodEstimated Value: $212,000 - $309,000
3
Beds
2
Baths
1,297
Sq Ft
$184/Sq Ft
Est. Value
About This Home
This home is located at 17806 Ridgewood Dr, Hazel Crest, IL 60429 and is currently estimated at $239,040, approximately $184 per square foot. 17806 Ridgewood Dr is a home located in Cook County with nearby schools including Mae Jemison School, Prairie-Hills Junior High School, and Hillcrest High School.
Ownership History
Date
Name
Owned For
Owner Type
Purchase Details
Closed on
Jan 3, 2008
Sold by
Us Bank Na
Bought by
Williams Leatha
Current Estimated Value
Home Financials for this Owner
Home Financials are based on the most recent Mortgage that was taken out on this home.
Original Mortgage
$136,000
Interest Rate
5.9%
Mortgage Type
Unknown
Purchase Details
Closed on
Oct 2, 2007
Sold by
Brazile Jimmie
Bought by
Us Bank Na and Csfb Abs Trust Series Heat 2002-1
Purchase Details
Closed on
Nov 13, 2000
Sold by
Jackson Dwayne and Jackson Charmaine
Bought by
Brazile Jimmie and Brazile Erma
Home Financials for this Owner
Home Financials are based on the most recent Mortgage that was taken out on this home.
Original Mortgage
$138,977
Interest Rate
12.2%
Create a Home Valuation Report for This Property
The Home Valuation Report is an in-depth analysis detailing your home's value as well as a comparison with similar homes in the area
Home Values in the Area
Average Home Value in this Area
Purchase History
| Date | Buyer | Sale Price | Title Company |
|---|---|---|---|
| Williams Leatha | $136,000 | Ticor Title | |
| Us Bank Na | -- | None Available | |
| Brazile Jimmie | -- | First American Title |
Source: Public Records
Mortgage History
| Date | Status | Borrower | Loan Amount |
|---|---|---|---|
| Previous Owner | Williams Leatha | $136,000 | |
| Previous Owner | Brazile Jimmie | $138,977 |
Source: Public Records
Tax History
| Year | Tax Paid | Tax Assessment Tax Assessment Total Assessment is a certain percentage of the fair market value that is determined by local assessors to be the total taxable value of land and additions on the property. | Land | Improvement |
|---|---|---|---|---|
| 2025 | $7,188 | $20,000 | $3,177 | $16,823 |
| 2024 | $7,188 | $20,000 | $3,177 | $16,823 |
| 2023 | $1,936 | $20,000 | $3,177 | $16,823 |
| 2022 | $1,936 | $10,770 | $2,804 | $7,966 |
| 2021 | $1,817 | $10,768 | $2,803 | $7,965 |
| 2020 | $7,234 | $10,768 | $2,803 | $7,965 |
| 2019 | $5,070 | $11,001 | $2,616 | $8,385 |
| 2018 | $4,909 | $11,001 | $2,616 | $8,385 |
| 2017 | $4,623 | $11,001 | $2,616 | $8,385 |
| 2016 | $4,173 | $9,635 | $2,242 | $7,393 |
| 2015 | $3,927 | $9,635 | $2,242 | $7,393 |
| 2014 | $3,860 | $9,635 | $2,242 | $7,393 |
| 2013 | $4,376 | $11,766 | $2,242 | $9,524 |
Source: Public Records
Map
Nearby Homes
- 2908 Buttonwood Walk
- 17804 Pebblewood Ln
- 17910 Millstone Rd
- 17622 Oakwood Dr
- 17714 Dogwood Ln
- 5 E Carriageway Dr Unit 201
- 17803 Dogwood Ln
- 17805 Dogwood Ln
- 7 E Carriageway Dr Unit 311
- 17613 Grandview Dr
- 3068 Hickory Rd
- 2715 Knollwood Place
- 17742 Larkspur Ln
- 17405 Longfellow Ave
- 2722 Cherrywood Place
- 2912 175th St
- 17731 Larkspur Ln
- 2900 175th St
- 2711 Larkspur Ln
- 17417 Kedzie Ave
- 17804 Ridgewood Dr
- 17808 Ridgewood Dr
- 17802 Ridgewood Dr
- 17810 Ridgewood Dr
- 17805 Stonebridge Dr
- 17805 Ridgewood Dr
- 17803 Stonebridge Dr
- 17807 Stonebridge Dr
- 17800 Ridgewood Dr
- 17812 Ridgewood Dr
- 17803 Ridgewood Dr
- 17809 Ridgewood Dr
- 17801 Stonebridge Dr
- 17809 Stonebridge Dr
- 3011 Buttonwood Walk
- 17811 Ridgewood Dr
- 3012 Greenwood Rd
- 17725 Stonebridge Dr
- 17724 Ridgewood Dr
- 17811 Stonebridge Dr
Your Personal Tour Guide
Ask me questions while you tour the home.