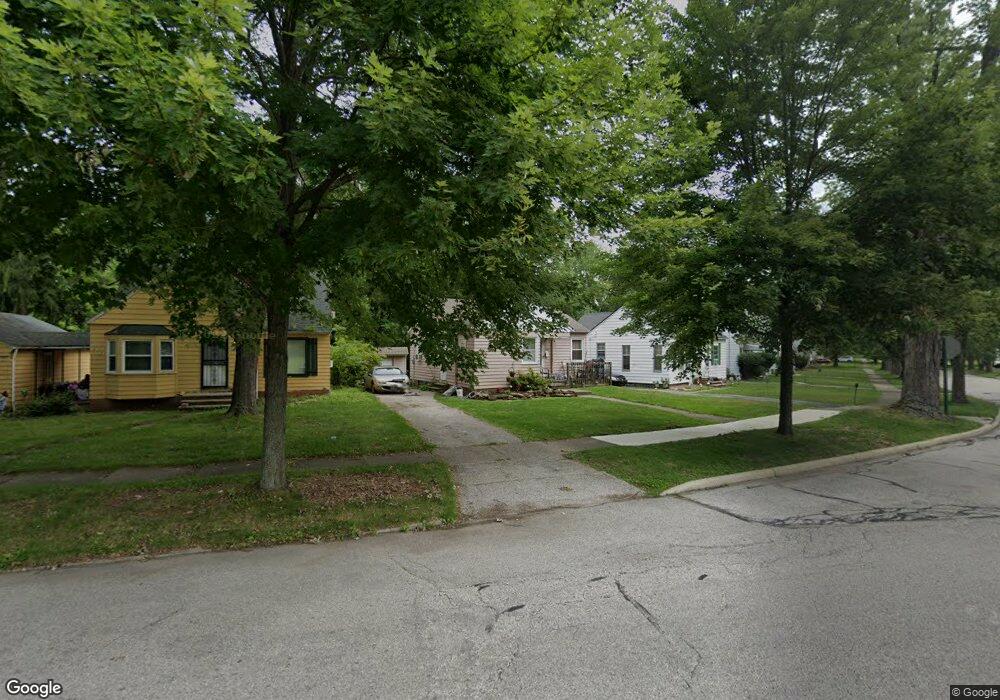
17807 Maple Heights Blvd Maple Heights, OH 44137
Estimated Value: $71,000 - $113,000
2
Beds
1
Bath
644
Sq Ft
$138/Sq Ft
Est. Value
About This Home
This home is located at 17807 Maple Heights Blvd, Maple Heights, OH 44137 and is currently estimated at $88,624, approximately $137 per square foot. 17807 Maple Heights Blvd is a home located in Cuyahoga County with nearby schools including Abraham Lincoln Elementary School, Rockside/ J.F. Kennedy School, and Italy High School.
Ownership History
Date
Name
Owned For
Owner Type
Purchase Details
Closed on
Mar 15, 2022
Sold by
Woodacre Properties One Llc
Bought by
Bossone John M
Current Estimated Value
Purchase Details
Closed on
Jul 26, 2005
Sold by
Cabot Daniel J and Cabot Patricia B
Bought by
Woodacre Properties One Llc
Purchase Details
Closed on
Apr 20, 1994
Bought by
Cabot Renovation, Inc.
Purchase Details
Closed on
Jul 2, 1993
Sold by
Glover Michael A
Bought by
Sec Of H U D
Purchase Details
Closed on
Jun 29, 1989
Sold by
Reed Richard R
Bought by
Glover Michael A
Purchase Details
Closed on
Jun 20, 1979
Sold by
Muetzel Larry J
Bought by
Reed Richard R
Purchase Details
Closed on
Jun 28, 1978
Sold by
Sabol Michael J
Bought by
Muetzel Larry J
Purchase Details
Closed on
Sep 8, 1977
Sold by
Beebe Clara
Bought by
Sabol Michael J
Purchase Details
Closed on
Jan 1, 1975
Bought by
Beebe Clara
Create a Home Valuation Report for This Property
The Home Valuation Report is an in-depth analysis detailing your home's value as well as a comparison with similar homes in the area
Home Values in the Area
Average Home Value in this Area
Purchase History
| Date | Buyer | Sale Price | Title Company |
|---|---|---|---|
| Bossone John M | $29,900 | Titleco Title Agency | |
| Woodacre Properties One Llc | -- | Public | |
| Cabot Renovation, Inc. | -- | -- | |
| Sec Of H U D | -- | -- | |
| Glover Michael A | $45,900 | -- | |
| Reed Richard R | $44,500 | -- | |
| Muetzel Larry J | $37,900 | -- | |
| Sabol Michael J | $28,000 | -- | |
| Beebe Clara | -- | -- |
Source: Public Records
Tax History Compared to Growth
Tax History
| Year | Tax Paid | Tax Assessment Tax Assessment Total Assessment is a certain percentage of the fair market value that is determined by local assessors to be the total taxable value of land and additions on the property. | Land | Improvement |
|---|---|---|---|---|
| 2024 | $2,582 | $26,110 | $7,385 | $18,725 |
| 2023 | $2,374 | $20,970 | $5,530 | $15,440 |
| 2022 | $2,366 | $20,970 | $5,530 | $15,440 |
| 2021 | $2,518 | $20,970 | $5,530 | $15,440 |
| 2020 | $2,163 | $15,890 | $4,200 | $11,690 |
| 2019 | $2,147 | $45,400 | $12,000 | $33,400 |
| 2018 | $2,136 | $15,890 | $4,200 | $11,690 |
| 2017 | $2,144 | $15,610 | $5,460 | $10,150 |
| 2016 | $2,071 | $15,610 | $5,460 | $10,150 |
| 2015 | $2,068 | $15,610 | $5,460 | $10,150 |
| 2014 | $2,068 | $17,160 | $5,990 | $11,170 |
Source: Public Records
Map
Nearby Homes
- 17806 Maple Heights Blvd
- 17912 North Blvd
- 17916 North Blvd
- 5425 Grasmere Ave
- 5257 Philip Ave
- 5493 Thomas St
- 17204 Maple Heights Blvd
- 5239 Arch St
- 5320 Clement Ave
- 5231 Philip Ave
- 5212 Catherine St
- 5234 Erwin St
- 5357 Beechwood Ave
- 5199 Arch St
- 5540 Dalewood Ave
- 5185 Clement Ave
- 5208 Clement Ave
- 5562 Dalewood Ave
- 5570 Dalewood Ave
- 5409 Hollywood Ave
- 17811 North Blvd
- 17801 Maple Heights Blvd
- 17815 North Blvd
- 5357 Thomas St
- 17703 Maple Heights Blvd
- 17903 North Blvd
- 5353 Thomas St
- 17907 North Blvd
- 5349 Thomas St
- 17802 Maple Heights Blvd
- 17905 Maple Heights Blvd
- 17911 North Blvd
- 17704 Maple Heights Blvd
- 17810 Maple Heights Blvd
- 17700 Maple Heights Blvd
- 17615 Maple Heights Blvd
- 17915 North Blvd
- 17900 Maple Heights Blvd
- 5341 Thomas St
- 17909 Maple Heights Blvd