Estimated Value: $591,000 - $655,000
3
Beds
2
Baths
2,016
Sq Ft
$307/Sq Ft
Est. Value
About This Home
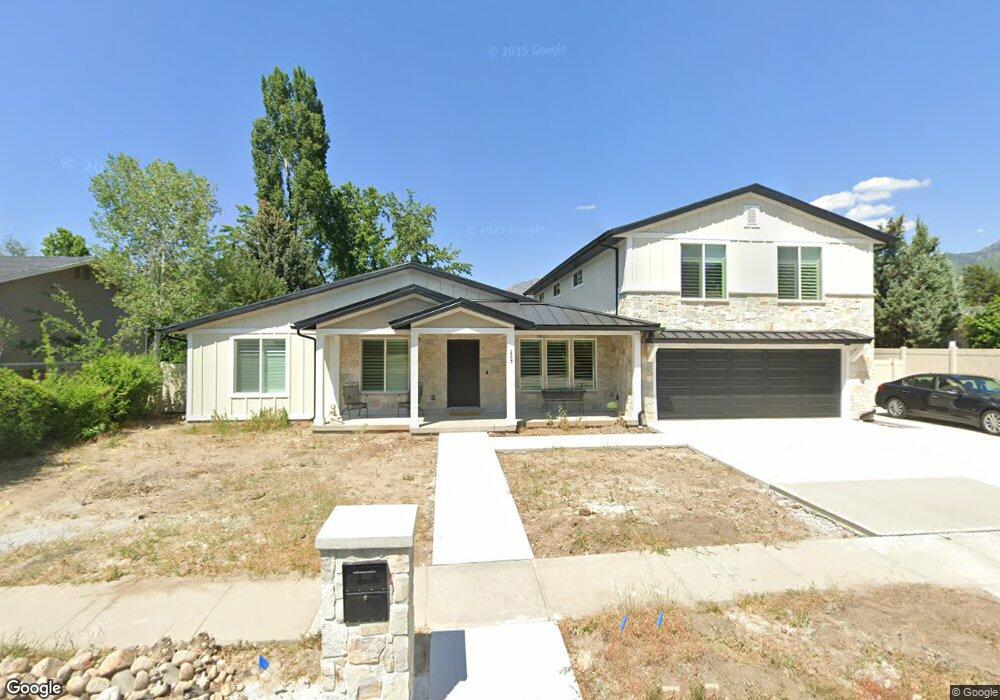
This home is located at 1781 E Paulista Way, Sandy, UT 84093 and is currently estimated at $618,285, approximately $306 per square foot. 1781 E Paulista Way is a home located in Salt Lake County with nearby schools including Oakdale School, Albion Middle School, and Hillcrest High School.
Ownership History
Date
Name
Owned For
Owner Type
Purchase Details
Closed on
Jul 29, 2025
Sold by
Maughan Franklin David and Vanmaughan Beth Van
Bought by
Shupe Cory Amos and Shupe Melissa Maughan
Current Estimated Value
Purchase Details
Closed on
Dec 12, 2024
Sold by
Shupe Cory Amos and Shupe Melissa Maughan
Bought by
Cory And Melissa Shupe Family Trust and Shupe
Purchase Details
Closed on
Apr 4, 2024
Sold by
Shupe Cory Amos and Shupe Melissa Maughan
Bought by
Maughan Franklin David and Vanmaughan Beth Van
Purchase Details
Closed on
Jan 11, 2023
Sold by
Any Acting Successor To Loertscher Livin
Bought by
Shupe Cory Amos and Shupe Melissa Maughan
Purchase Details
Closed on
Apr 21, 2016
Sold by
Loertscher Barbara D
Bought by
Loertscher Barbara D and The Loertscher Living Trust
Purchase Details
Closed on
May 26, 2009
Sold by
Loertscher Barbara V
Bought by
Loertscher Barbara D
Home Financials for this Owner
Home Financials are based on the most recent Mortgage that was taken out on this home.
Original Mortgage
$360,000
Interest Rate
3.57%
Mortgage Type
Reverse Mortgage Home Equity Conversion Mortgage
Create a Home Valuation Report for This Property
The Home Valuation Report is an in-depth analysis detailing your home's value as well as a comparison with similar homes in the area
Home Values in the Area
Average Home Value in this Area
Purchase History
| Date | Buyer | Sale Price | Title Company |
|---|---|---|---|
| Shupe Cory Amos | -- | None Listed On Document | |
| Cory And Melissa Shupe Family Trust | -- | None Listed On Document | |
| Maughan Franklin David | -- | None Listed On Document | |
| Shupe Cory Amos | -- | Investors Title | |
| Loertscher Barbara D | -- | None Available | |
| Loertscher Barbara D | -- | First American Title |
Source: Public Records
Mortgage History
| Date | Status | Borrower | Loan Amount |
|---|---|---|---|
| Previous Owner | Loertscher Barbara D | $360,000 |
Source: Public Records
Tax History Compared to Growth
Tax History
| Year | Tax Paid | Tax Assessment Tax Assessment Total Assessment is a certain percentage of the fair market value that is determined by local assessors to be the total taxable value of land and additions on the property. | Land | Improvement |
|---|---|---|---|---|
| 2025 | $2,746 | $520,600 | $310,000 | $210,600 |
| 2024 | $2,746 | $514,800 | $298,500 | $216,300 |
| 2023 | $2,728 | $510,500 | $287,000 | $223,500 |
| 2022 | $1,502 | $582,600 | $281,400 | $301,200 |
| 2021 | $1,163 | $406,600 | $215,600 | $191,000 |
| 2020 | $2,580 | $381,500 | $215,600 | $165,900 |
| 2019 | $2,485 | $358,600 | $203,400 | $155,200 |
| 2018 | $0 | $337,300 | $203,400 | $133,900 |
| 2017 | $461 | $292,700 | $203,400 | $89,300 |
| 2016 | $1,839 | $256,600 | $183,300 | $73,300 |
| 2015 | $1,684 | $217,800 | $194,300 | $23,500 |
| 2014 | $1,611 | $204,700 | $188,800 | $15,900 |
Source: Public Records
Map
Nearby Homes
- 1666 Paulista Way
- 8492 S Mesa Dr
- 1597 Paulista Way
- 1990 E Terra Vista Way
- 1924 E Viscounti Cove
- 8638 Piper Ln
- 8483 S Terrace Dr
- 2131 Gad Way
- 8571 Monitor Dr
- 1327 Madrid Way
- 1430 E 8685 S
- 2161 E Lorita Way
- 1393 E Galaxie Dr
- 1235 E Cottonwood Hills Dr
- 1263 E Cottonwood Hills Dr
- 1563 E Granada Cir
- 2238 Cottonwood Cove Ln
- 2120 E Newcastle Dr
- 9039 S 1660 E
- 1169 E Cottonwood Hills Dr Unit 56
- 1781 Paulista Way
- 1777 Paulista Way
- 1777 E Paulista Way
- 8364 Viscounti Dr
- 8364 S Viscounti Dr
- 8346 Viscounti Dr
- 8346 S Viscounti Dr
- 1784 Janella Way
- 1773 Paulista Way
- 8332 Viscounti Dr
- 1780 Julho St
- 1780 E Julho St
- 1780 Janella Way
- 1776 Paulista Way
- 1784 E Paulista Way
- 1784 Paulista Way
- 1769 E Paulista Way
- 1769 Paulista Way
- 1776 Janella Way
- 8357 Viscounti Dr