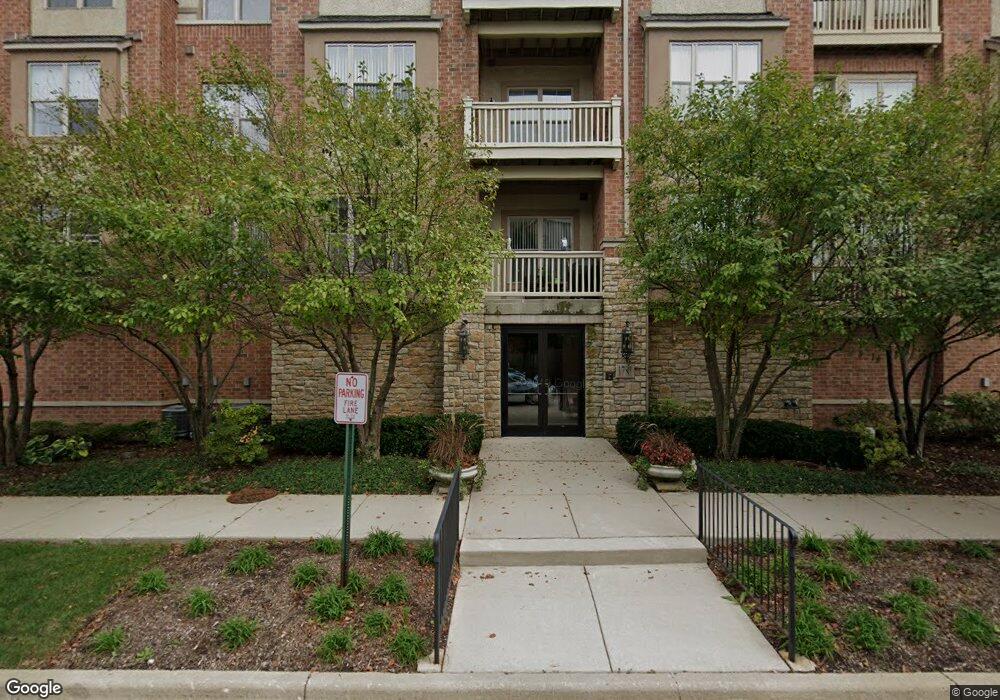
1781 Tudor Ln Unit 307 Northbrook, IL 60062
Estimated Value: $372,000 - $431,000
2
Beds
2
Baths
1,967
Sq Ft
$202/Sq Ft
Est. Value
About This Home
This home is located at 1781 Tudor Ln Unit 307, Northbrook, IL 60062 and is currently estimated at $398,287, approximately $202 per square foot. 1781 Tudor Ln Unit 307 is a home located in Cook County with nearby schools including Wescott Elementary School, Maple School, and Glenbrook North High School.
Ownership History
Date
Name
Owned For
Owner Type
Purchase Details
Closed on
May 6, 2010
Sold by
Jpmorgan Chase Bank National Association
Bought by
Mooney Colleen D
Current Estimated Value
Purchase Details
Closed on
Apr 13, 2010
Sold by
Federal Home Loan Mortgage Corporation
Bought by
Jpmorgan Chase Bank National Association
Purchase Details
Closed on
Mar 20, 2009
Sold by
Lim Eun Kyun
Bought by
Federal Home Loan Mortgage Corp
Purchase Details
Closed on
Aug 5, 2004
Sold by
Rsd Shermer Building Four Llc
Bought by
Lim Eun Kyun and Lim Hae Young
Home Financials for this Owner
Home Financials are based on the most recent Mortgage that was taken out on this home.
Original Mortgage
$257,500
Interest Rate
5.5%
Mortgage Type
Purchase Money Mortgage
Create a Home Valuation Report for This Property
The Home Valuation Report is an in-depth analysis detailing your home's value as well as a comparison with similar homes in the area
Home Values in the Area
Average Home Value in this Area
Purchase History
| Date | Buyer | Sale Price | Title Company |
|---|---|---|---|
| Mooney Colleen D | $190,000 | Fatic | |
| Jpmorgan Chase Bank National Association | -- | None Available | |
| Federal Home Loan Mortgage Corp | -- | None Available | |
| Lim Eun Kyun | $333,500 | Cti |
Source: Public Records
Mortgage History
| Date | Status | Borrower | Loan Amount |
|---|---|---|---|
| Previous Owner | Lim Eun Kyun | $257,500 |
Source: Public Records
Tax History Compared to Growth
Tax History
| Year | Tax Paid | Tax Assessment Tax Assessment Total Assessment is a certain percentage of the fair market value that is determined by local assessors to be the total taxable value of land and additions on the property. | Land | Improvement |
|---|---|---|---|---|
| 2024 | $6,412 | $27,129 | $1,641 | $25,488 |
| 2023 | $6,237 | $27,129 | $1,641 | $25,488 |
| 2022 | $6,237 | $27,129 | $1,641 | $25,488 |
| 2021 | $4,390 | $16,905 | $787 | $16,118 |
| 2020 | $4,347 | $16,905 | $787 | $16,118 |
| 2019 | $4,187 | $18,588 | $787 | $17,801 |
| 2018 | $5,183 | $21,235 | $688 | $20,547 |
| 2017 | $5,076 | $21,235 | $688 | $20,547 |
| 2016 | $4,567 | $21,235 | $688 | $20,547 |
| 2015 | $4,315 | $18,022 | $557 | $17,465 |
| 2014 | $4,208 | $18,022 | $557 | $17,465 |
| 2013 | $4,154 | $18,022 | $557 | $17,465 |
Source: Public Records
Map
Nearby Homes
- 1950 Farnsworth Ln Unit 202
- 1997 Kingsley Cir
- 1947 Summerton Place
- 2117 Illinois Rd
- 1721 Elm Ave
- 2221 Illinois Rd
- 1412 Sycamore Ln
- 2067 Butternut Ln
- 1430 Voltz Rd
- 2411 Woodlawn Rd
- 1302 Waukegan Rd
- 1443 Woodhill Dr
- 2130 Mallard Dr
- 1179 Shermer Rd
- 2409 Center Ave
- 2050 Valencia Dr Unit 405C
- 2378 Salceda Dr Unit 25B2378S
- 1060 Cedar Ln
- 1823 Milton Ave
- 1913 Milton Ave
- 1781 Tudor Ln Unit P24
- 1781 Tudor Ln Unit P12
- 1781 Tudor Ln Unit P38
- 1781 Tudor Ln Unit P5
- 1781 Tudor Ln Unit 207
- 1781 Tudor Ln Unit 110
- 1781 Tudor Ln Unit 302
- 1781 Tudor Ln Unit 305
- 1781 Tudor Ln Unit 209
- 1781 Tudor Ln Unit P37
- 1781 Tudor Ln Unit P35
- 1781 Tudor Ln Unit P33
- 1781 Tudor Ln Unit P31
- 1781 Tudor Ln Unit P26
- 1781 Tudor Ln Unit P1
- 1781 Tudor Ln Unit 309
- 1781 Tudor Ln Unit P23
- 1781 Tudor Ln Unit P22
- 1781 Tudor Ln Unit P19
- 1781 Tudor Ln Unit P18