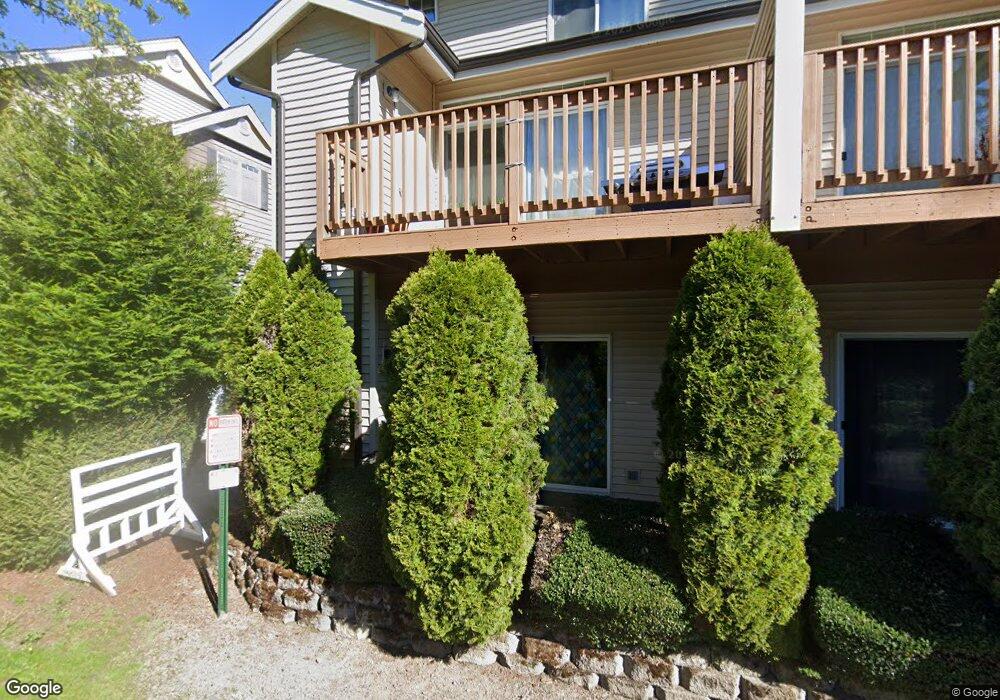
17811 80th Ave NE Unit B5 Kenmore, WA 98028
Estimated Value: $652,000 - $668,000
2
Beds
3
Baths
1,606
Sq Ft
$410/Sq Ft
Est. Value
About This Home
This home is located at 17811 80th Ave NE Unit B5, Kenmore, WA 98028 and is currently estimated at $657,747, approximately $409 per square foot. 17811 80th Ave NE Unit B5 is a home located in King County with nearby schools including Kenmore Elementary School, Kenmore Middle School, and Inglemoor High School.
Ownership History
Date
Name
Owned For
Owner Type
Purchase Details
Closed on
Apr 12, 2021
Sold by
Sullivan Karen K
Bought by
Hector Lucas and Tanuyan Elaine
Current Estimated Value
Home Financials for this Owner
Home Financials are based on the most recent Mortgage that was taken out on this home.
Original Mortgage
$510,750
Outstanding Balance
$461,515
Interest Rate
3.05%
Mortgage Type
New Conventional
Estimated Equity
$196,232
Purchase Details
Closed on
Aug 1, 2005
Sold by
Auria Townhomes Llc
Bought by
Sullivan Karen K
Home Financials for this Owner
Home Financials are based on the most recent Mortgage that was taken out on this home.
Original Mortgage
$203,950
Interest Rate
5.62%
Mortgage Type
Fannie Mae Freddie Mac
Create a Home Valuation Report for This Property
The Home Valuation Report is an in-depth analysis detailing your home's value as well as a comparison with similar homes in the area
Home Values in the Area
Average Home Value in this Area
Purchase History
| Date | Buyer | Sale Price | Title Company |
|---|---|---|---|
| Hector Lucas | $567,500 | Cw Title | |
| Sullivan Karen K | $254,950 | Transnation Ti |
Source: Public Records
Mortgage History
| Date | Status | Borrower | Loan Amount |
|---|---|---|---|
| Open | Hector Lucas | $510,750 | |
| Previous Owner | Sullivan Karen K | $203,950 |
Source: Public Records
Tax History Compared to Growth
Tax History
| Year | Tax Paid | Tax Assessment Tax Assessment Total Assessment is a certain percentage of the fair market value that is determined by local assessors to be the total taxable value of land and additions on the property. | Land | Improvement |
|---|---|---|---|---|
| 2024 | $5,617 | $553,000 | $53,800 | $499,200 |
| 2023 | $4,841 | $611,000 | $89,600 | $521,400 |
| 2022 | $4,749 | $532,000 | $89,600 | $442,400 |
| 2021 | $4,926 | $427,000 | $74,700 | $352,300 |
| 2020 | $5,293 | $411,000 | $74,700 | $336,300 |
| 2018 | $4,226 | $427,000 | $53,800 | $373,200 |
| 2017 | $3,627 | $345,000 | $50,800 | $294,200 |
| 2016 | $3,446 | $301,000 | $47,800 | $253,200 |
| 2015 | $3,352 | $284,000 | $41,800 | $242,200 |
| 2014 | -- | $265,000 | $41,800 | $223,200 |
| 2013 | -- | $231,000 | $38,800 | $192,200 |
Source: Public Records
Map
Nearby Homes
- 7721 NE 175th St Unit 104
- 18011 83rd Ave NE
- 7614 NE Bothell Way Unit 11
- 7711 NE 175th St Unit B210
- 18217 83rd Ave NE
- 18319 83rd Place NE
- 18150 73rd Ave NE Unit 306
- 18520 83rd Ave NE
- 7301 NE 175th St Unit 335
- 7301 NE 175th St Unit 215
- 7301 NE 175th St
- 7301 NE 175th St Unit 331
- 7301 NE 175th St Unit 114
- 7301 NE 175th St Unit 209
- 7301 NE 175th St Unit 137
- 7223 NE 175th St Unit 108
- 8401 NE 169th St
- 18200 73rd Ave NE Unit A113
- 7031 NE 175th St Unit 5
- 7245 NE 170th St
- 17811 80th Ave NE Unit C1
- 17811 80th Ave NE Unit C6
- 17811 80th Ave NE Unit D5
- 17811 80th Ave NE Unit C5
- 17811 80th Ave NE Unit B2
- 17811 80th Ave NE Unit D1
- 17811 80th Ave NE Unit D7
- 17811 80th Ave NE Unit D9
- 17811 80th Ave NE Unit E2
- 17811 80th Ave NE Unit E1
- 17811 80th Ave NE Unit E3
- 17811 80th Ave NE Unit B6
- 17811 80th Ave NE Unit B4
- 17811 80th Ave NE Unit B3
- 17811 80th Ave NE Unit D8
- 17811 80th Ave NE Unit D6
- 17811 80th Ave NE Unit B1
- 17811 80th Ave NE Unit A9
- 17811 80th Ave NE Unit A8
- 17811 80th Ave NE Unit A7