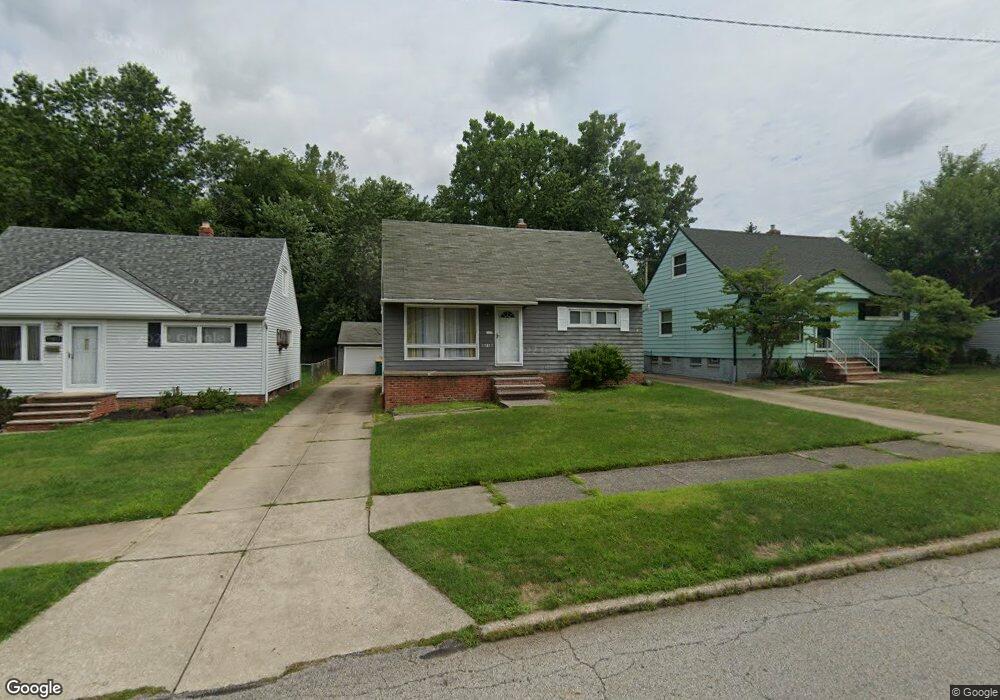
17817 Hazelwood Ave Maple Heights, OH 44137
Estimated Value: $115,294 - $206,000
2
Beds
1
Bath
832
Sq Ft
$174/Sq Ft
Est. Value
About This Home
This home is located at 17817 Hazelwood Ave, Maple Heights, OH 44137 and is currently estimated at $144,574, approximately $173 per square foot. 17817 Hazelwood Ave is a home located in Cuyahoga County with nearby schools including Abraham Lincoln Elementary School, Rockside/ J.F. Kennedy School, and Barack Obama School.
Ownership History
Date
Name
Owned For
Owner Type
Purchase Details
Closed on
Jun 28, 2006
Sold by
Gosha Jeffrey and Gosha Delores
Bought by
Gosha Shawnta and Gosha Delores
Current Estimated Value
Home Financials for this Owner
Home Financials are based on the most recent Mortgage that was taken out on this home.
Original Mortgage
$97,750
Outstanding Balance
$58,288
Interest Rate
6.73%
Mortgage Type
New Conventional
Estimated Equity
$86,286
Purchase Details
Closed on
Oct 31, 1995
Sold by
Mcnerney Raymond E
Bought by
Gosha Jeffery and Gosha Delores
Home Financials for this Owner
Home Financials are based on the most recent Mortgage that was taken out on this home.
Original Mortgage
$77,600
Interest Rate
7.65%
Mortgage Type
New Conventional
Purchase Details
Closed on
Jul 15, 1982
Sold by
Mcnerney Raymond E and Mcnerney Ruth
Bought by
Mcnerney Raymond E
Purchase Details
Closed on
Jan 1, 1975
Bought by
Mcnerney Raymond E and Mcnerney Ruth
Create a Home Valuation Report for This Property
The Home Valuation Report is an in-depth analysis detailing your home's value as well as a comparison with similar homes in the area
Home Values in the Area
Average Home Value in this Area
Purchase History
| Date | Buyer | Sale Price | Title Company |
|---|---|---|---|
| Gosha Shawnta | -- | Five Star Title Agency Inc | |
| Gosha Jeffery | $81,700 | -- | |
| Mcnerney Raymond E | -- | -- | |
| Mcnerney Raymond E | -- | -- |
Source: Public Records
Mortgage History
| Date | Status | Borrower | Loan Amount |
|---|---|---|---|
| Open | Gosha Shawnta | $97,750 | |
| Closed | Gosha Jeffery | $77,600 |
Source: Public Records
Tax History
| Year | Tax Paid | Tax Assessment Tax Assessment Total Assessment is a certain percentage of the fair market value that is determined by local assessors to be the total taxable value of land and additions on the property. | Land | Improvement |
|---|---|---|---|---|
| 2024 | $2,819 | $30,450 | $7,420 | $23,030 |
| 2023 | $1,957 | $17,430 | $5,320 | $12,110 |
| 2022 | $1,950 | $17,430 | $5,320 | $12,110 |
| 2021 | $2,072 | $17,430 | $5,320 | $12,110 |
| 2020 | $1,784 | $13,200 | $4,030 | $9,170 |
| 2019 | $1,771 | $37,700 | $11,500 | $26,200 |
| 2018 | $2,637 | $21,180 | $4,030 | $17,150 |
| 2017 | $1,793 | $13,200 | $5,180 | $8,020 |
| 2016 | $3,548 | $21,490 | $5,180 | $16,310 |
| 2015 | $3,971 | $21,490 | $5,180 | $16,310 |
| 2014 | $3,971 | $23,630 | $5,710 | $17,920 |
Source: Public Records
Map
Nearby Homes
- 5493 Thomas St
- 5481 Dalewood Ave
- 18301 Edinboro Ave
- 157 Flora Dr
- 158 Flora Dr
- 17409 Mapleboro Ave
- 5666 Waterbury Ave
- 17916 North Blvd
- 5716 South Blvd
- 5728 South Blvd
- 5713 South Blvd
- 5736 South Blvd
- 5550 Grasmere Ave
- 18717 Waterbury Ave
- 18811 Waterbury Ave
- 17005 Mapleboro Ave
- 75 Greencroft Rd
- 59 Greencroft Rd
- 17914 Libby Rd
- 5357 Beechwood Ave
- 17813 Hazelwood Ave
- 17821 Hazelwood Ave
- 17809 Hazelwood Ave
- 17805 Hazelwood Ave
- 5516 South Blvd
- 5512 South Blvd
- 5520 South Blvd
- 5508 South Blvd
- 17816 Hazelwood Ave
- 17812 Hazelwood Ave
- 17820 Hazelwood Ave
- 17801 Hazelwood Ave
- 5504 South Blvd
- 5530 South Blvd
- 17808 Hazelwood Ave
- 5500 South Blvd
- 17804 Hazelwood Ave
- 5534 South Blvd
- 17800 Hazelwood Ave
- 5538 South Blvd
Your Personal Tour Guide
Ask me questions while you tour the home.