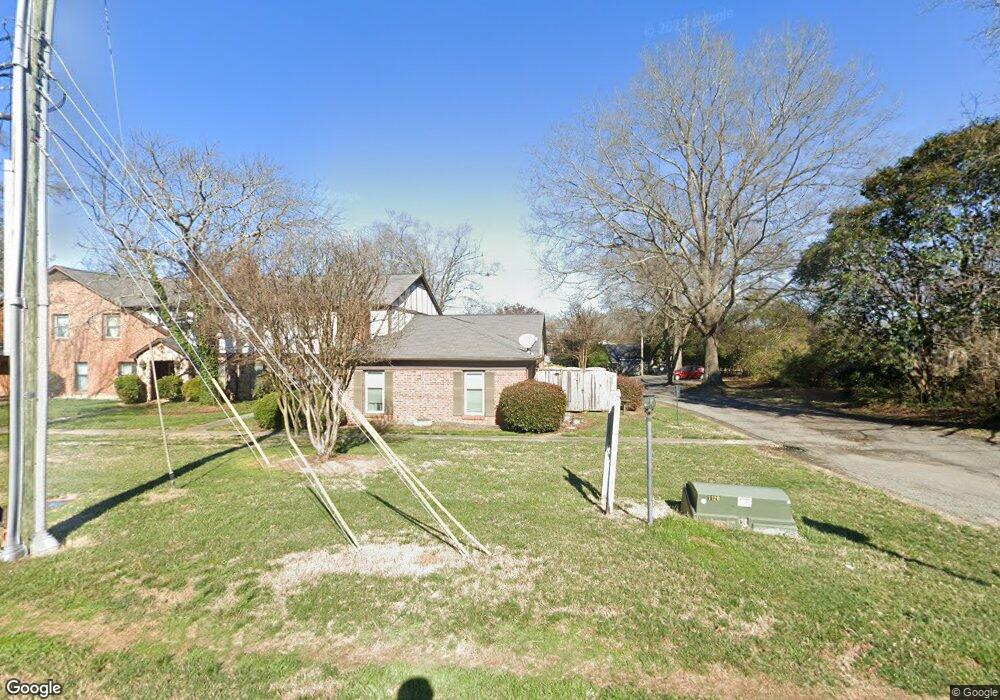
1782 Ebenezer Rd Unit 1782E Rock Hill, SC 29732
Estimated Value: $161,000 - $278,000
--
Bed
--
Bath
1,440
Sq Ft
$149/Sq Ft
Est. Value
About This Home
This home is located at 1782 Ebenezer Rd Unit 1782E, Rock Hill, SC 29732 and is currently estimated at $214,412, approximately $148 per square foot. 1782 Ebenezer Rd Unit 1782E is a home located in York County with nearby schools including Ebinport Elementary School, W.C. Sullivan Middle School, and South Pointe High School.
Ownership History
Date
Name
Owned For
Owner Type
Purchase Details
Closed on
Feb 17, 2010
Sold by
Jacobs George F and Jacobs Claire L
Bought by
Jacobs George F and Jacobs Claire L
Current Estimated Value
Purchase Details
Closed on
Mar 12, 2009
Sold by
Jacobs George F
Bought by
Jacobs George F and Jacobs Claire L
Purchase Details
Closed on
Mar 3, 2009
Sold by
Us Bank National Association
Bought by
Jacobs George F
Purchase Details
Closed on
Nov 18, 2008
Sold by
Allen Thea Denise and Case #08-Cp-46-2970
Bought by
U S Bank National Association
Purchase Details
Closed on
Feb 28, 2005
Sold by
Moore Mary Mcneill
Bought by
Allen Thea Denise
Home Financials for this Owner
Home Financials are based on the most recent Mortgage that was taken out on this home.
Original Mortgage
$16,200
Interest Rate
5.6%
Mortgage Type
Stand Alone Second
Create a Home Valuation Report for This Property
The Home Valuation Report is an in-depth analysis detailing your home's value as well as a comparison with similar homes in the area
Home Values in the Area
Average Home Value in this Area
Purchase History
| Date | Buyer | Sale Price | Title Company |
|---|---|---|---|
| Jacobs George F | -- | -- | |
| Jacobs George F | -- | -- | |
| Jacobs George F | $42,000 | -- | |
| U S Bank National Association | $10,000 | -- | |
| Allen Thea Denise | $81,000 | -- |
Source: Public Records
Mortgage History
| Date | Status | Borrower | Loan Amount |
|---|---|---|---|
| Previous Owner | Allen Thea Denise | $16,200 | |
| Previous Owner | Allen Thea Denise | $64,800 |
Source: Public Records
Tax History Compared to Growth
Tax History
| Year | Tax Paid | Tax Assessment Tax Assessment Total Assessment is a certain percentage of the fair market value that is determined by local assessors to be the total taxable value of land and additions on the property. | Land | Improvement |
|---|---|---|---|---|
| 2024 | $1,939 | $4,382 | $0 | $4,382 |
| 2023 | $1,942 | $4,382 | $0 | $4,382 |
| 2022 | $1,851 | $4,382 | $0 | $4,382 |
| 2021 | -- | $4,382 | $0 | $4,382 |
| 2020 | $1,814 | $4,382 | $0 | $0 |
| 2019 | $1,617 | $3,810 | $0 | $0 |
| 2018 | $1,593 | $3,810 | $0 | $0 |
| 2017 | $1,538 | $3,810 | $0 | $0 |
| 2016 | $1,508 | $3,810 | $0 | $0 |
| 2014 | $1,707 | $4,230 | $0 | $4,230 |
| 2013 | $1,707 | $4,500 | $0 | $4,500 |
Source: Public Records
Map
Nearby Homes
- 1784 Ebenezer Rd
- 1806 Ebenezer Rd Unit E
- 1792 Ebenezer Rd Unit G
- 1830 Ebenezer Rd Unit 1
- 248 Pointe Cir
- 1910 Ebenezer Rd
- 1937 Ebenezer Rd
- 2014 Steeplechase Dr
- 130 Bailey Ave
- 606 Clouds Way
- 448 Berryman Rd
- 405 Jenny Skip Ln
- 310 Berkeley Rd
- 302 Ginsberg Rd
- 306 Ginsberg Rd
- Garland Plan at Allston
- Gable Plan at Allston
- 310 Ginsberg Rd
- 555 Stockton Way
- 651 Melville Dr
- 1782 Ebenezer Rd Unit B
- 1782 Ebenezer Rd Unit F
- 1782 Ebenezer Rd Unit A
- 1782 Ebenezer Rd Unit D
- 1782 Ebenezer Rd Unit C
- 1782 Ebenezer Rd
- 1780 Ebenezer Rd Unit 1780
- 1806 Ebenezer Rd Unit A
- 1806 Ebenezer Rd Unit C
- 1806 Ebenezer Rd Unit 1806
- 1806 Ebenezer Rd Unit F
- 1806 Ebenezer Rd Unit D
- 1806 Ebenezer Rd Unit C
- 1806 Ebenezer Rd
- 1806 Ebenezer Rd Unit E
- 1780 Ebenezer Rd Unit D
- 1780 Ebenezer Rd Unit C
- 1780 Ebenezer Rd
- 1780 Ebenezer Rd Unit D
- 1780 Ebenezer Rd Unit E