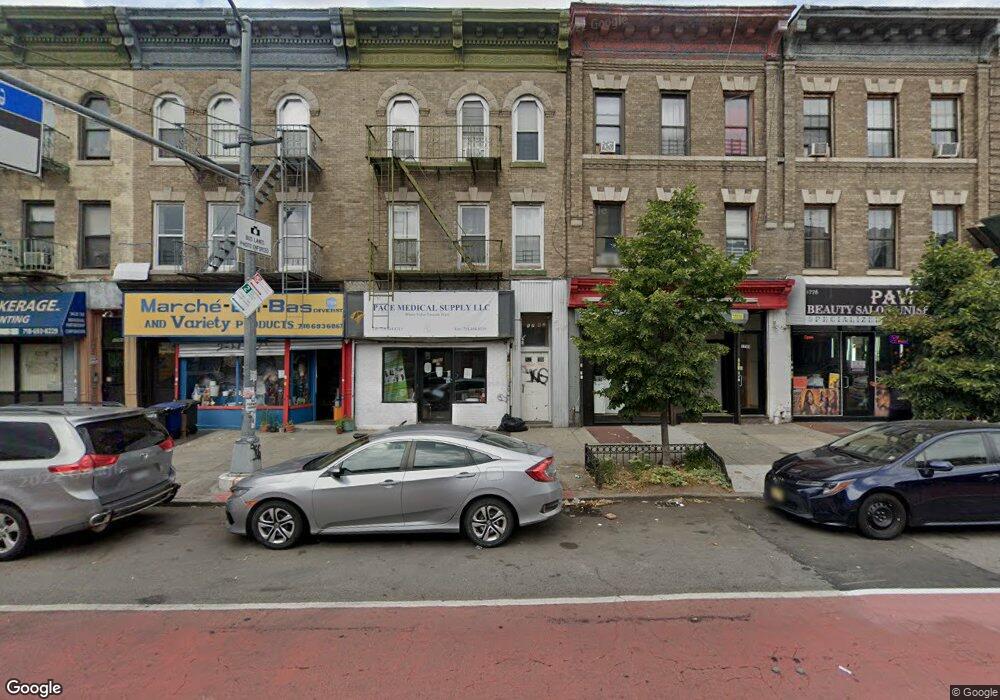
1782 Nostrand Ave Unit 2F Brooklyn, NY 11226
Flatbush NeighborhoodEstimated Value: $455,749
2
Beds
1
Bath
4,380
Sq Ft
$104/Sq Ft
Est. Value
About This Home
This home is located at 1782 Nostrand Ave Unit 2F, Brooklyn, NY 11226 and is currently estimated at $455,749, approximately $104 per square foot. 1782 Nostrand Ave Unit 2F is a home located in Kings County with nearby schools including Middle School 246 Walt Whitman, Central Brooklyn Ascend Charter, and Flatbush Ascend Charter School.
Ownership History
Date
Name
Owned For
Owner Type
Purchase Details
Closed on
Oct 28, 2024
Sold by
Luthra Sunder
Bought by
Khana Sena
Current Estimated Value
Purchase Details
Closed on
Jul 6, 2018
Sold by
Khana Sena
Bought by
Kwp Group Llc
Home Financials for this Owner
Home Financials are based on the most recent Mortgage that was taken out on this home.
Original Mortgage
$400,000
Interest Rate
4.6%
Mortgage Type
New Conventional
Purchase Details
Closed on
Feb 27, 1997
Sold by
Alpha Reo Corp
Bought by
Harris Symonous
Home Financials for this Owner
Home Financials are based on the most recent Mortgage that was taken out on this home.
Original Mortgage
$94,500
Interest Rate
7.85%
Mortgage Type
Commercial
Create a Home Valuation Report for This Property
The Home Valuation Report is an in-depth analysis detailing your home's value as well as a comparison with similar homes in the area
Home Values in the Area
Average Home Value in this Area
Purchase History
| Date | Buyer | Sale Price | Title Company |
|---|---|---|---|
| Khana Sena | $436,000 | -- | |
| Kwp Group Llc | -- | -- | |
| Khana Sena | $1,100,000 | -- | |
| Kwp Group Llc | -- | -- | |
| Khana Sena | $1,100,000 | -- | |
| Harris Symonous | $126,000 | Ticor Title Guarantee Compan | |
| Harris Symonous | $126,000 | Ticor Title Guarantee Compan |
Source: Public Records
Mortgage History
| Date | Status | Borrower | Loan Amount |
|---|---|---|---|
| Previous Owner | Kwp Group Llc | $400,000 | |
| Previous Owner | Harris Symonous | $94,500 |
Source: Public Records
Tax History Compared to Growth
Tax History
| Year | Tax Paid | Tax Assessment Tax Assessment Total Assessment is a certain percentage of the fair market value that is determined by local assessors to be the total taxable value of land and additions on the property. | Land | Improvement |
|---|---|---|---|---|
| 2025 | $13,257 | $287,550 | $8,100 | $279,450 |
| 2024 | $13,257 | $239,760 | $8,100 | $231,660 |
| 2023 | $13,008 | $199,800 | $8,100 | $191,700 |
| 2022 | $12,529 | $205,200 | $8,100 | $197,100 |
| 2021 | $11,638 | $241,200 | $8,100 | $233,100 |
| 2020 | $8,728 | $241,200 | $8,100 | $233,100 |
| 2019 | $10,288 | $301,320 | $8,100 | $293,220 |
| 2018 | $10,375 | $81,571 | $1,754 | $79,817 |
| 2017 | $10,019 | $78,770 | $1,964 | $76,806 |
| 2016 | $9,408 | $72,976 | $2,005 | $70,971 |
| 2015 | $6,105 | $67,574 | $1,846 | $65,728 |
| 2014 | $6,105 | $62,747 | $2,057 | $60,690 |
Source: Public Records
Map
Nearby Homes
- 1776 Nostrand Ave
- 1773 Nostrand Ave
- 349 E 28th St
- 332 E 28th St
- 2724 Clarendon Rd Unit 1
- 381 E 31st St
- 259 E 28th St Unit 3
- 1173 Rogers Ave Unit 4 C
- 1173 Rogers Ave Unit 5 B
- 1089 Rogers Ave
- 1193 Rogers Ave
- 357 E 26th St
- 1685 Nostrand Ave
- 1196 New York Ave
- 2701 Newkirk Ave Unit 3H
- 2701 Newkirk Ave Unit 3D
- 2701 Newkirk Ave Unit 7F
- 2701 Newkirk Ave Unit 3A
- 2701 Newkirk Ave Unit 7A
- 448 E 29th St
- 1782 Nostrand Ave Unit 6
- 1784 Nostrand Ave
- 1784 Nostrand Ave Unit 1R
- 1778 Nostrand Ave Unit 4
- 1778 Nostrand Ave Unit 2
- 1774 Nostrand Ave
- 1772 Nostrand Ave Unit 3
- 1772 Nostrand Ave Unit 2
- 1772 Nostrand Ave
- 335 E 29th St
- 329 E 29th St
- 337 E 29th St
- 337 E 29th St Unit 2
- 337 E 29 St
- 337 E 29 Th St
- 337 E 29 Th St Unit 2
- 339 E 29th St Unit 2
- 339 E 29th St
- 339 E 29 Th St
- 339 E 29 Th St Unit 1