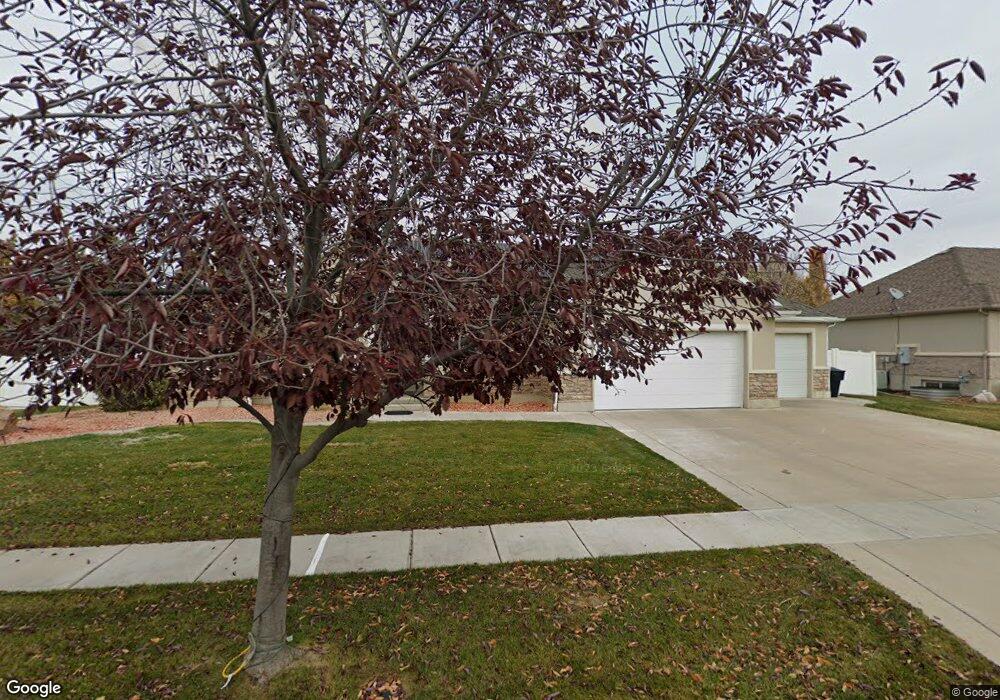
1782 W 2525 S Syracuse, UT 84075
Estimated Value: $589,000 - $651,000
5
Beds
3
Baths
3,533
Sq Ft
$178/Sq Ft
Est. Value
About This Home
This home is located at 1782 W 2525 S, Syracuse, UT 84075 and is currently estimated at $630,252, approximately $178 per square foot. 1782 W 2525 S is a home located in Davis County with nearby schools including Syracuse Elementary School, Syracuse Junior High School, and Syracuse High School.
Ownership History
Date
Name
Owned For
Owner Type
Purchase Details
Closed on
Feb 1, 2007
Sold by
Beesley Clair and Beesley Martha
Bought by
Beesley Clair D and Beesley Martha D
Current Estimated Value
Home Financials for this Owner
Home Financials are based on the most recent Mortgage that was taken out on this home.
Original Mortgage
$293,000
Outstanding Balance
$172,021
Interest Rate
6.17%
Mortgage Type
New Conventional
Estimated Equity
$458,231
Purchase Details
Closed on
Jan 13, 2005
Sold by
Dalbout David A and Dalbout Karen
Bought by
Becelary Clair and Becelary Martin
Home Financials for this Owner
Home Financials are based on the most recent Mortgage that was taken out on this home.
Original Mortgage
$58,000
Interest Rate
5.8%
Mortgage Type
Stand Alone Second
Purchase Details
Closed on
Aug 12, 2003
Sold by
Dalebout David A
Bought by
Dalebout David A and Dalebout Karen
Home Financials for this Owner
Home Financials are based on the most recent Mortgage that was taken out on this home.
Original Mortgage
$53,000
Interest Rate
4.65%
Mortgage Type
Purchase Money Mortgage
Purchase Details
Closed on
Jul 14, 2003
Sold by
Bauer Glen
Bought by
Dalebout David and Dalebout Karen
Home Financials for this Owner
Home Financials are based on the most recent Mortgage that was taken out on this home.
Original Mortgage
$53,000
Interest Rate
4.65%
Mortgage Type
Purchase Money Mortgage
Purchase Details
Closed on
Jun 3, 2003
Sold by
Martell Robin
Bought by
Bauer Glen
Home Financials for this Owner
Home Financials are based on the most recent Mortgage that was taken out on this home.
Original Mortgage
$36,820
Interest Rate
5.18%
Mortgage Type
Seller Take Back
Purchase Details
Closed on
Apr 14, 2003
Sold by
Bauer Lana A
Bought by
Martell Robin
Home Financials for this Owner
Home Financials are based on the most recent Mortgage that was taken out on this home.
Original Mortgage
$253,678
Interest Rate
5.73%
Mortgage Type
Seller Take Back
Purchase Details
Closed on
Apr 4, 2003
Sold by
Bauer Glen L
Bought by
Bauer Lana A
Home Financials for this Owner
Home Financials are based on the most recent Mortgage that was taken out on this home.
Original Mortgage
$253,678
Interest Rate
5.73%
Mortgage Type
Seller Take Back
Purchase Details
Closed on
Jul 26, 2001
Sold by
Rainey Homes Inc
Bought by
Bauer Glen L and Bauer Lana A
Home Financials for this Owner
Home Financials are based on the most recent Mortgage that was taken out on this home.
Original Mortgage
$232,000
Interest Rate
8.87%
Purchase Details
Closed on
Aug 4, 2000
Sold by
Rainey Construction Inc
Bought by
Rainey Joe M
Home Financials for this Owner
Home Financials are based on the most recent Mortgage that was taken out on this home.
Original Mortgage
$240,000
Interest Rate
8.12%
Create a Home Valuation Report for This Property
The Home Valuation Report is an in-depth analysis detailing your home's value as well as a comparison with similar homes in the area
Home Values in the Area
Average Home Value in this Area
Purchase History
We collect this data history from publicly available records. To have your information removed, we recommend requesting removal directly through your county’s website.
| Date | Buyer | Sale Price | Title Company |
|---|---|---|---|
| Beesley Clair D | -- | None Available | |
| Becelary Clair | -- | None Available | |
| Dalebout David A | -- | Bonneville Title Company Inc | |
| Dalebout David A | -- | Bonneville Title Company Inc | |
| Dalebout David | -- | Mountain View Title & Escrow | |
| Bauer Glen | -- | -- | |
| Martell Robin | -- | -- | |
| Bauer Lana A | -- | Mountain View Title & Escrow | |
| Bauer Glen L | -- | Heritage West Title Insuranc | |
| Rainey Homes Inc | -- | Heritage West Title Insuranc | |
| Rainey Joe M | -- | Heritage West Title Insuranc |
Source: Public Records
Mortgage History
We collect this data history from publicly available records. To have your information removed, we recommend requesting removal directly through your county’s website.
| Date | Status | Borrower | Loan Amount |
|---|---|---|---|
| Open | Beesley Clair D | $293,000 | |
| Closed | Becelary Clair | $58,000 | |
| Previous Owner | Dalebout David A | $53,000 | |
| Previous Owner | Dalebout David | $36,820 | |
| Previous Owner | Martell Robin | $253,678 | |
| Previous Owner | Bauer Glen L | $232,000 | |
| Previous Owner | Rainey Joe M | $240,000 |
Source: Public Records
Tax History
| Year | Tax Paid | Tax Assessment Tax Assessment Total Assessment is a certain percentage of the fair market value that is determined by local assessors to be the total taxable value of land and additions on the property. | Land | Improvement |
|---|---|---|---|---|
| 2025 | $3,306 | $319,000 | $121,032 | $197,968 |
| 2024 | $3,154 | $306,350 | $102,348 | $204,002 |
| 2023 | $3,040 | $538,000 | $142,480 | $395,520 |
| 2022 | $3,265 | $316,800 | $81,706 | $235,094 |
| 2021 | $2,869 | $431,000 | $121,001 | $309,999 |
| 2020 | $2,572 | $374,000 | $104,274 | $269,726 |
| 2019 | $2,626 | $377,000 | $103,307 | $273,693 |
| 2018 | $2,463 | $351,000 | $99,027 | $251,973 |
| 2016 | $2,216 | $165,605 | $37,958 | $127,647 |
| 2015 | $2,179 | $155,045 | $37,958 | $117,087 |
| 2014 | $2,178 | $157,955 | $37,958 | $119,997 |
| 2013 | -- | $152,410 | $37,902 | $114,508 |
Source: Public Records
Map
Nearby Homes
- 1857 W 2575 S
- 2460 Allison Way
- 1876 W 2400 S
- 2543 S 2000 W
- 1653 W 2700 S Unit 218
- 1643 W 2700 S Unit 216
- 1667 W 2770 S Unit 206
- 1699 W 2115 S
- 1397 W 2275 S
- 1953 W 2100 S
- 2104 W 2200 S
- 1694 2975 S Unit D
- 1664 2975 S Unit B
- 1294 W 2375 S
- 1283 W 2375 S
- 2001 S 1800 W
- 1284 W 2375 S
- 3009 S Edgewater Ln W
- 2366 S 1230 W
- 1796 W 1975 S
Your Personal Tour Guide
Ask me questions while you tour the home.