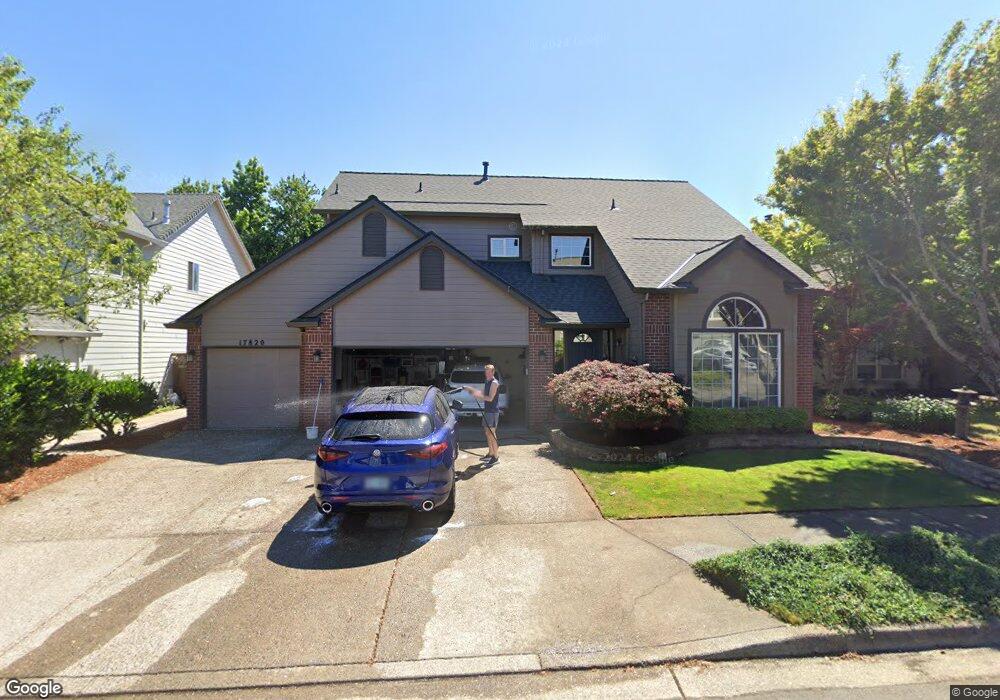
17820 SW 111th Ave Tualatin, OR 97062
Estimated Value: $593,793 - $659,000
3
Beds
3
Baths
1,993
Sq Ft
$314/Sq Ft
Est. Value
About This Home
This home is located at 17820 SW 111th Ave, Tualatin, OR 97062 and is currently estimated at $625,198, approximately $313 per square foot. 17820 SW 111th Ave is a home located in Washington County with nearby schools including Deer Creek Elementary School, Hazelbrook Middle School, and Tualatin High School.
Ownership History
Date
Name
Owned For
Owner Type
Purchase Details
Closed on
Jul 14, 2006
Sold by
Rice Doug
Bought by
Rice Douglas S
Current Estimated Value
Home Financials for this Owner
Home Financials are based on the most recent Mortgage that was taken out on this home.
Original Mortgage
$270,000
Outstanding Balance
$157,888
Interest Rate
6.57%
Mortgage Type
New Conventional
Estimated Equity
$467,310
Purchase Details
Closed on
Jun 2, 2004
Sold by
Krayer William Brad and Krayer Stacey Ann
Bought by
Rice Doug
Home Financials for this Owner
Home Financials are based on the most recent Mortgage that was taken out on this home.
Original Mortgage
$208,800
Interest Rate
5.5%
Mortgage Type
Unknown
Purchase Details
Closed on
Jan 29, 1997
Sold by
Smith James N and Smith Julie A
Bought by
Krayer William Brad and Krayer Stacey Ann
Home Financials for this Owner
Home Financials are based on the most recent Mortgage that was taken out on this home.
Original Mortgage
$157,600
Interest Rate
7.74%
Mortgage Type
Balloon
Create a Home Valuation Report for This Property
The Home Valuation Report is an in-depth analysis detailing your home's value as well as a comparison with similar homes in the area
Home Values in the Area
Average Home Value in this Area
Purchase History
| Date | Buyer | Sale Price | Title Company |
|---|---|---|---|
| Rice Douglas S | -- | Lawyers Title Ins | |
| Rice Doug | $261,000 | Pacific Nw Title | |
| Krayer William Brad | $197,000 | Ticor Title Insurance |
Source: Public Records
Mortgage History
| Date | Status | Borrower | Loan Amount |
|---|---|---|---|
| Open | Rice Douglas S | $270,000 | |
| Closed | Rice Doug | $208,800 | |
| Previous Owner | Krayer William Brad | $157,600 | |
| Closed | Rice Doug | $26,000 |
Source: Public Records
Tax History Compared to Growth
Tax History
| Year | Tax Paid | Tax Assessment Tax Assessment Total Assessment is a certain percentage of the fair market value that is determined by local assessors to be the total taxable value of land and additions on the property. | Land | Improvement |
|---|---|---|---|---|
| 2026 | $6,069 | $367,530 | -- | -- |
| 2025 | $6,069 | $356,830 | -- | -- |
| 2024 | $5,910 | $346,440 | -- | -- |
| 2023 | $5,910 | $323,890 | $0 | $0 |
| 2022 | $5,445 | $323,890 | $0 | $0 |
| 2021 | $5,312 | $305,310 | $0 | $0 |
| 2020 | $5,155 | $296,420 | $0 | $0 |
| 2019 | $5,016 | $287,790 | $0 | $0 |
| 2018 | $4,813 | $279,410 | $0 | $0 |
| 2017 | $4,531 | $271,280 | $0 | $0 |
| 2016 | $4,320 | $263,380 | $0 | $0 |
| 2015 | $4,146 | $255,710 | $0 | $0 |
| 2014 | $3,920 | $248,270 | $0 | $0 |
Source: Public Records
Map
Nearby Homes
- 10609 SW Hazelbrook Rd
- 10495 SW Kellogg Dr
- 11542 SW Royal Villa Dr
- 11444 SW Royal Villa Dr Unit 165
- 11560 SW Royal Villa Dr
- 11656 SW Royal Villa Dr Unit 71
- 12130 SW Pond Ln
- 10763 SW River Dr
- 17895 SW Chippewa Trail
- 9774 SW Tualatin Rd Unit 203
- 11768 SW Royal Villa Dr Unit 124
- 9700 SW Tualatin Rd Unit 12
- 9700 SW Tualatin Rd Unit 5
- 9700 SW Tualatin Rd Unit 9
- 9811 SW Herman Rd Unit 45
- 9735 SW Tualatin Rd
- 11686 SW Royal Villa Dr Unit 83
- 11602 SW Royal Villa Dr
- 11698 SW Royal Villa Dr
- 16715 SW Queen Anne Ave
- 17800 SW 111th Ave
- 17850 SW 111th Ave
- 17870 SW 111th Ave
- 11065 SW Wintu Ct
- 11070 SW Wintu Ct
- 17780 SW 111th Ave
- 17815 SW 111th Ave
- 17845 SW 111th Ave
- 17900 SW 111th Ave
- 17795 SW 111th Ave
- 17760 SW 111th Ave
- 17865 SW 111th Ave
- 11060 SW Wishram Ct
- 11050 SW Wintu Ct
- 11045 SW Wintu Ct
- 17930 SW 111th Ave
- 17775 SW 111th Ave
- 11080 SW Wishram Ct
- 17840 SW 112th Ave
- 17925 SW 111th Ave