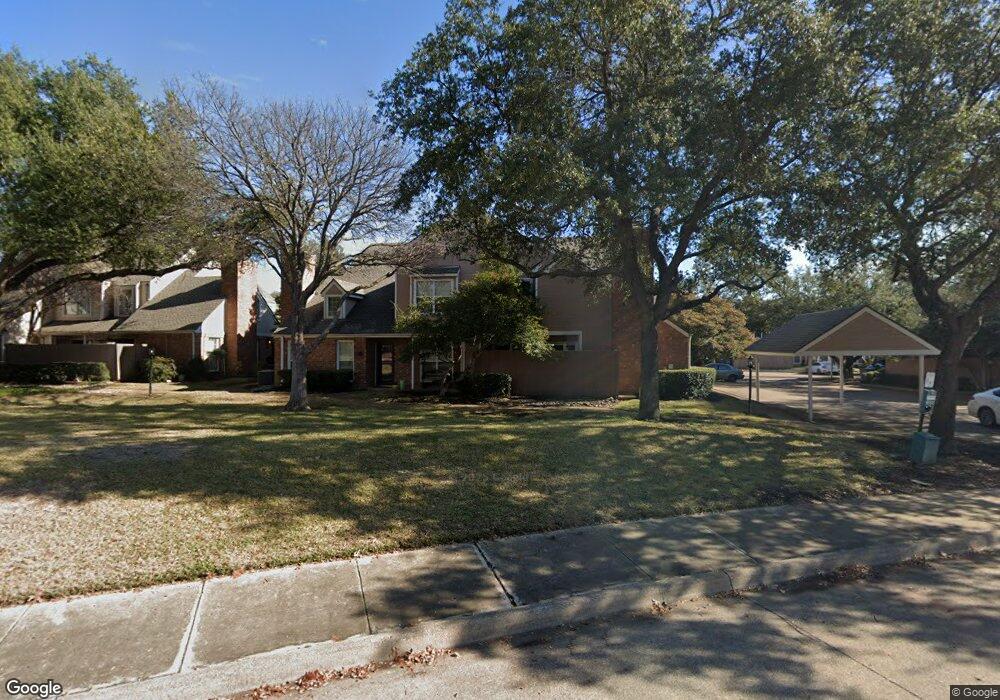
17820 Windflower Way Unit 1001 Dallas, TX 75252
Prestonwood West NeighborhoodEstimated Value: $303,000 - $330,000
2
Beds
3
Baths
1,297
Sq Ft
$241/Sq Ft
Est. Value
About This Home
This home is located at 17820 Windflower Way Unit 1001, Dallas, TX 75252 and is currently estimated at $312,813, approximately $241 per square foot. 17820 Windflower Way Unit 1001 is a home located in Collin County with nearby schools including Frankford Middle, Shepton High School, and Plano West Senior High School.
Ownership History
Date
Name
Owned For
Owner Type
Purchase Details
Closed on
Jun 16, 2014
Sold by
Jessup James David
Bought by
Jessup Kristine P
Current Estimated Value
Purchase Details
Closed on
Mar 18, 2005
Sold by
Holland Charles T and Holland Nancysue
Bought by
Jessup James David and Jessup Kristine P
Home Financials for this Owner
Home Financials are based on the most recent Mortgage that was taken out on this home.
Original Mortgage
$105,600
Outstanding Balance
$53,749
Interest Rate
5.67%
Estimated Equity
$259,064
Purchase Details
Closed on
Apr 30, 2004
Sold by
Copeland Janice
Bought by
Holland Charles T and Holland Nancy Sue
Home Financials for this Owner
Home Financials are based on the most recent Mortgage that was taken out on this home.
Original Mortgage
$119,160
Interest Rate
5.38%
Create a Home Valuation Report for This Property
The Home Valuation Report is an in-depth analysis detailing your home's value as well as a comparison with similar homes in the area
Home Values in the Area
Average Home Value in this Area
Purchase History
| Date | Buyer | Sale Price | Title Company |
|---|---|---|---|
| Jessup Kristine P | -- | None Available | |
| Jessup James David | -- | -- | |
| Holland Charles T | -- | Rtt |
Source: Public Records
Mortgage History
| Date | Status | Borrower | Loan Amount |
|---|---|---|---|
| Open | Jessup James David | $105,600 | |
| Previous Owner | Holland Charles T | $119,160 | |
| Closed | Jessup James David | $26,400 |
Source: Public Records
Tax History Compared to Growth
Tax History
| Year | Tax Paid | Tax Assessment Tax Assessment Total Assessment is a certain percentage of the fair market value that is determined by local assessors to be the total taxable value of land and additions on the property. | Land | Improvement |
|---|---|---|---|---|
| 2025 | $3,687 | $291,800 | $93,231 | $204,949 |
| 2024 | $3,687 | $265,273 | $93,231 | $220,718 |
| 2023 | $3,687 | $241,157 | $93,231 | $212,243 |
| 2022 | $4,909 | $219,234 | $72,513 | $185,173 |
| 2021 | $4,670 | $199,304 | $56,975 | $142,329 |
| 2020 | $4,578 | $193,174 | $51,795 | $141,379 |
| 2019 | $4,862 | $196,249 | $51,795 | $144,454 |
| 2018 | $4,714 | $189,199 | $46,616 | $142,583 |
| 2017 | $4,317 | $176,701 | $41,436 | $135,265 |
| 2016 | $3,955 | $163,431 | $31,077 | $132,354 |
| 2015 | $2,065 | $143,246 | $20,718 | $122,528 |
Source: Public Records
Map
Nearby Homes
- 17860 Windflower Way Unit 1704
- 5940 Rosebud Dr
- 18011 Windflower Way
- 6020 Fallsview Ln
- 6204 Crested Butte Dr
- 5807 Covehaven Dr
- 5904 Richwater Dr
- 5944 Still Forest Dr
- 6014 Glen Heather Dr
- 6206 Berthoud Pass
- 5828 Fallsview Ln
- 6076 Thursby Ave
- 18231 Frankford Lakes Cir
- 18333 Roehampton Dr Unit 1117
- 18333 Roehampton Dr Unit 513
- 18333 Roehampton Dr Unit 225
- 18333 Roehampton Dr Unit 927
- 18333 Roehampton Dr Unit 921
- 18333 Roehampton Dr Unit 813
- 5909 Kenswick Ct
- 17820 Windflower Way Unit 1401
- 17820 Windflower Way Unit 401
- 17820 Windflower Way Unit 704
- 17820 Windflower Way Unit 701
- 17820 Windflower Way Unit 1302
- 17820 Windflower Way Unit 602
- 17820 Windflower Way Unit 901
- 17820 Windflower Way Unit 1102
- 17820 Windflower Way Unit 102
- 17820 Windflower Way Unit 403
- 17820 Windflower Way Unit 703
- 17820 Windflower Way Unit 1403
- 17820 Windflower Way Unit 801
- 17820 Windflower Way Unit 903
- 17820 Windflower Way Unit 302
- 17820 Windflower Way Unit 503
- 17820 Windflower Way Unit 103
- 17820 Windflower Way Unit 304
- 17820 Windflower Way Unit 303
- 17820 Windflower Way Unit 502