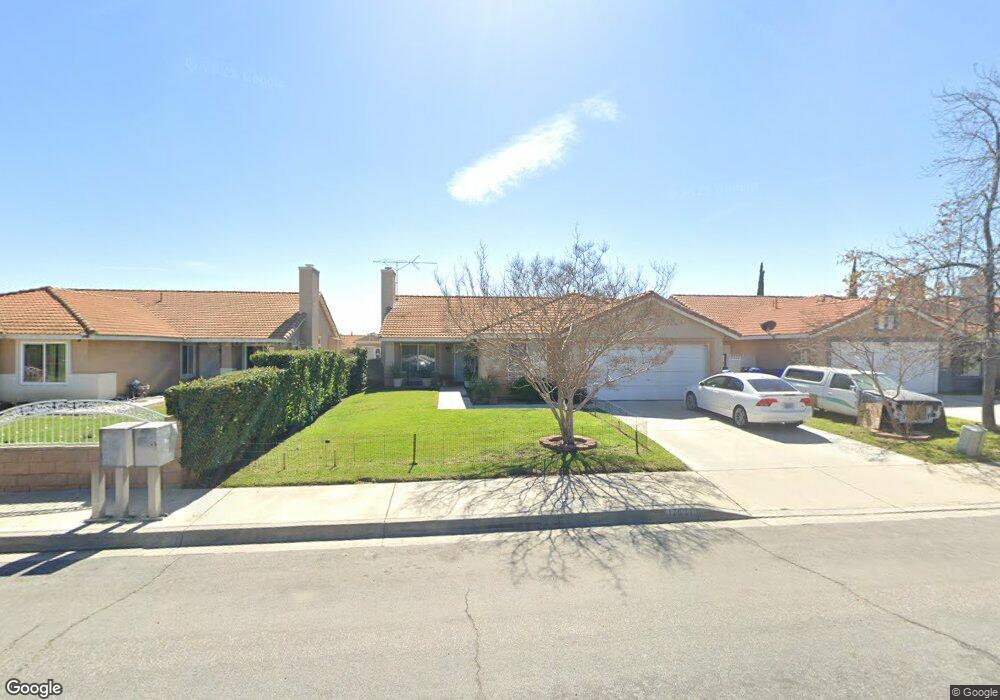
17827 Pine Ave Fontana, CA 92335
Estimated Value: $587,475 - $664,000
4
Beds
2
Baths
1,588
Sq Ft
$396/Sq Ft
Est. Value
About This Home
This home is located at 17827 Pine Ave, Fontana, CA 92335 and is currently estimated at $628,869, approximately $396 per square foot. 17827 Pine Ave is a home located in San Bernardino County with nearby schools including Maple Elementary School, Alder Middle School, and Jurupa Hills High School.
Ownership History
Date
Name
Owned For
Owner Type
Purchase Details
Closed on
Sep 20, 2001
Sold by
Hud
Bought by
Najarro Jose M and Najarro Ingrid
Current Estimated Value
Home Financials for this Owner
Home Financials are based on the most recent Mortgage that was taken out on this home.
Original Mortgage
$141,934
Interest Rate
6.63%
Purchase Details
Closed on
Mar 6, 2001
Sold by
California Housing Finance Agency
Bought by
Hud
Purchase Details
Closed on
Feb 28, 2001
Sold by
Candray Carlos
Bought by
California Housing Finance Agency
Purchase Details
Closed on
Dec 23, 1999
Sold by
Tract 15965 Llc
Bought by
Candray Carlos
Home Financials for this Owner
Home Financials are based on the most recent Mortgage that was taken out on this home.
Original Mortgage
$146,790
Interest Rate
7.68%
Mortgage Type
FHA
Create a Home Valuation Report for This Property
The Home Valuation Report is an in-depth analysis detailing your home's value as well as a comparison with similar homes in the area
Purchase History
We collect this data history from publicly available records. To have your information removed, we recommend requesting removal directly through your county’s website.
| Date | Buyer | Sale Price | Title Company |
|---|---|---|---|
| Najarro Jose M | $146,500 | Chicago Title | |
| Hud | -- | First American Title Ins Co | |
| California Housing Finance Agency | $161,628 | First Southwestern Title | |
| Candray Carlos | $148,000 | Orange Coast Title |
Source: Public Records
Mortgage History
We collect this data history from publicly available records. To have your information removed, we recommend requesting removal directly through your county’s website.
| Date | Status | Borrower | Loan Amount |
|---|---|---|---|
| Previous Owner | Najarro Jose M | $141,934 | |
| Previous Owner | Candray Carlos | $146,790 | |
| Closed | Candray Carlos | $4,440 |
Source: Public Records
Tax History
| Year | Tax Paid | Tax Assessment Tax Assessment Total Assessment is a certain percentage of the fair market value that is determined by local assessors to be the total taxable value of land and additions on the property. | Land | Improvement |
|---|---|---|---|---|
| 2025 | $2,793 | $216,174 | $54,045 | $162,129 |
| 2024 | $2,611 | $211,935 | $52,985 | $158,950 |
| 2023 | $3,165 | $207,779 | $51,946 | $155,833 |
| 2022 | $3,131 | $203,704 | $50,927 | $152,777 |
| 2021 | $3,085 | $199,709 | $49,928 | $149,781 |
| 2020 | $3,062 | $197,661 | $49,416 | $148,245 |
| 2019 | $2,977 | $193,785 | $48,447 | $145,338 |
| 2018 | $2,984 | $189,985 | $47,497 | $142,488 |
| 2017 | $2,955 | $186,260 | $46,566 | $139,694 |
| 2016 | $2,920 | $182,608 | $45,653 | $136,955 |
| 2015 | $2,871 | $179,865 | $44,967 | $134,898 |
| 2014 | $2,870 | $176,342 | $44,086 | $132,256 |
Source: Public Records
Map
Nearby Homes
- 9287 Alder Ave
- 9087 Rosecrest Ln
- 9081 Tangelo Ave
- 9431 Laurel Ave
- 17525 Pine Ave
- 8959 Boxwood Ave
- 9454 Frankfort Ave
- 17746 Merrill Ave
- 17480 Filbert St
- 17481 Filbert St
- 9050 Dumond Dr
- 9257 Palmetto Ave
- 17468 Grevillea St
- 9661 Tamarind Ave
- 17857 San Bernardino Ave
- 8787 Locust Ave Unit 24
- 8596 Laurel Ave
- 9873 Alder Ave Unit 32
- 9873 Alder Ave Unit 4
- 8646 Tamarind Ave
- 17817 Pine Ave
- 17837 Pine Ave
- 17807 Pine Ave
- 17847 Pine Ave
- 17822 Dianthus Ave
- 17812 Dianthus Ave
- 17832 Dianthus Ave
- 17802 Dianthus Ave
- 17842 Dianthus Ave
- 17857 Pine Ave
- 17820 Pine Ave
- 17852 Dianthus Ave
- 17794 Pine Ave
- 17830 Pine Ave
- 17792 Dianthus Ave
- 17867 Pine Ave
- 17767 Pine Ave
- 17826 Pine Ave
- 17862 Dianthus Ave
- 17782 Pine Ave
Your Personal Tour Guide
Ask me questions while you tour the home.