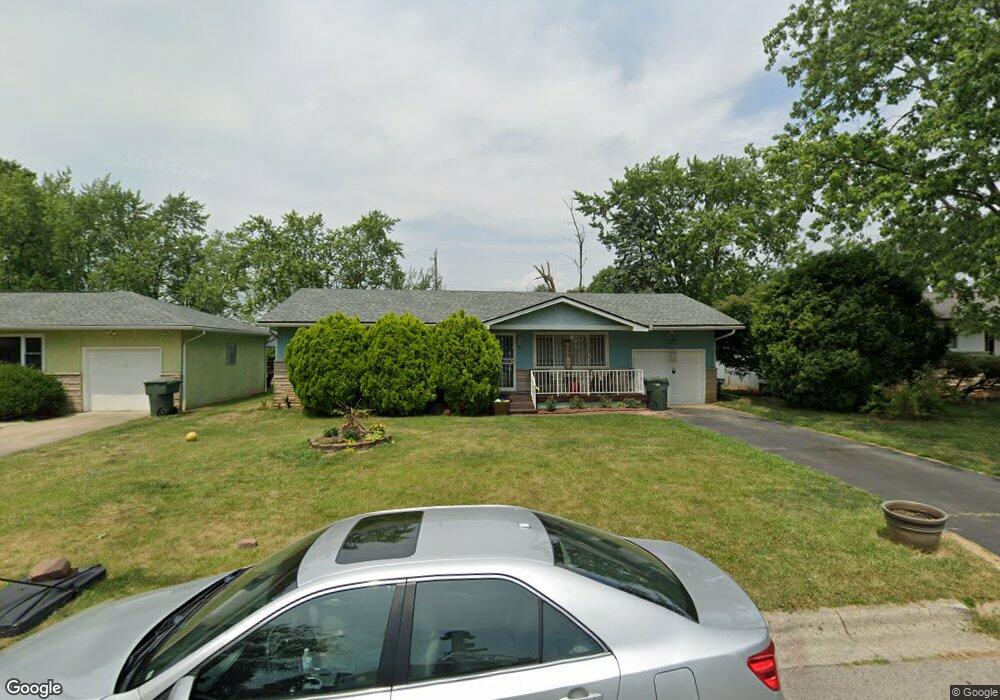
1783 Berkeley Rd Columbus, OH 43207
Innis Gardens Village NeighborhoodEstimated Value: $200,302 - $293,000
3
Beds
2
Baths
1,450
Sq Ft
$158/Sq Ft
Est. Value
About This Home
This home is located at 1783 Berkeley Rd, Columbus, OH 43207 and is currently estimated at $229,576, approximately $158 per square foot. 1783 Berkeley Rd is a home located in Franklin County with nearby schools including Moler Elementary School, South High School, and Summit Academy Community School-Columbus.
Ownership History
Date
Name
Owned For
Owner Type
Purchase Details
Closed on
Aug 24, 2005
Sold by
Thompson Nancy L and Thompson Nancy
Bought by
Thompson Denise
Current Estimated Value
Purchase Details
Closed on
Sep 25, 2002
Sold by
Thompson Nancy L
Bought by
Thompson Denise
Purchase Details
Closed on
Aug 10, 1988
Bought by
Thompson Walter and Thompson Nancy
Purchase Details
Closed on
Jul 1, 1984
Create a Home Valuation Report for This Property
The Home Valuation Report is an in-depth analysis detailing your home's value as well as a comparison with similar homes in the area
Home Values in the Area
Average Home Value in this Area
Purchase History
| Date | Buyer | Sale Price | Title Company |
|---|---|---|---|
| Thompson Denise | -- | -- | |
| Thompson Denise | -- | -- | |
| Thompson Walter | $47,700 | -- | |
| -- | $52,900 | -- |
Source: Public Records
Tax History
| Year | Tax Paid | Tax Assessment Tax Assessment Total Assessment is a certain percentage of the fair market value that is determined by local assessors to be the total taxable value of land and additions on the property. | Land | Improvement |
|---|---|---|---|---|
| 2025 | $2,862 | $63,770 | $14,210 | $49,560 |
| 2024 | $2,862 | $63,770 | $14,210 | $49,560 |
| 2023 | $2,825 | $63,770 | $14,210 | $49,560 |
| 2022 | $1,427 | $27,510 | $6,440 | $21,070 |
| 2021 | $1,429 | $27,510 | $6,440 | $21,070 |
| 2020 | $1,431 | $27,510 | $6,440 | $21,070 |
| 2019 | $1,455 | $23,980 | $5,600 | $18,380 |
| 2018 | $800 | $23,980 | $5,600 | $18,380 |
| 2017 | $1,454 | $23,980 | $5,600 | $18,380 |
| 2016 | $1,644 | $24,820 | $6,090 | $18,730 |
| 2015 | $821 | $24,820 | $6,090 | $18,730 |
| 2014 | $1,496 | $24,820 | $6,090 | $18,730 |
| 2013 | $777 | $26,110 | $6,405 | $19,705 |
Source: Public Records
Map
Nearby Homes
- 1833 Berkeley Rd
- 1718 Weiler Ave
- 1172 E Woodrow Ave
- 1564 Smith Rd Unit 566
- 1283 E Innis Ave
- 1777 Lockbourne Rd
- 1595 Valcon Place
- 1330 Frebis Ave
- 1673 Liscomb Rd
- 1834 Pannell Ave
- 1739 Linwood Ave
- 1019 Lawrence Dr
- 1465 Lockbourne Rd
- 1418-1422 Miller Ave
- 1514-1518 Wilson Ave
- 1571 Wilson Ave
- 990 Reeb Ave
- 1428 Geers Place
- 1398 Lockbourne Rd
- 1568 Oakwood Ave
- 1773 Berkeley Rd
- 1793 Berkeley Rd
- 1803 Berkeley Rd
- 1763 Berkeley Rd
- 1794 Kelton Ave
- 1800 Kelton Ave
- 1782 Kelton Ave
- 1804 Kelton Ave
- 1819 Berkeley Rd
- 1770 Berkeley Rd
- 1776 Kelton Ave
- 1335 Mareco Place
- 1810 Kelton Ave
- 1806 Berkeley Rd
- 1761 Berkeley Rd
- 1299 Louis Dr
- 1342 Mareco Place
- 1823 Berkeley Rd
- 1818 Kelton Ave
- 1291 Louis Dr
Your Personal Tour Guide
Ask me questions while you tour the home.