Estimated Value: $334,404 - $409,000
3
Beds
2
Baths
1,348
Sq Ft
$267/Sq Ft
Est. Value
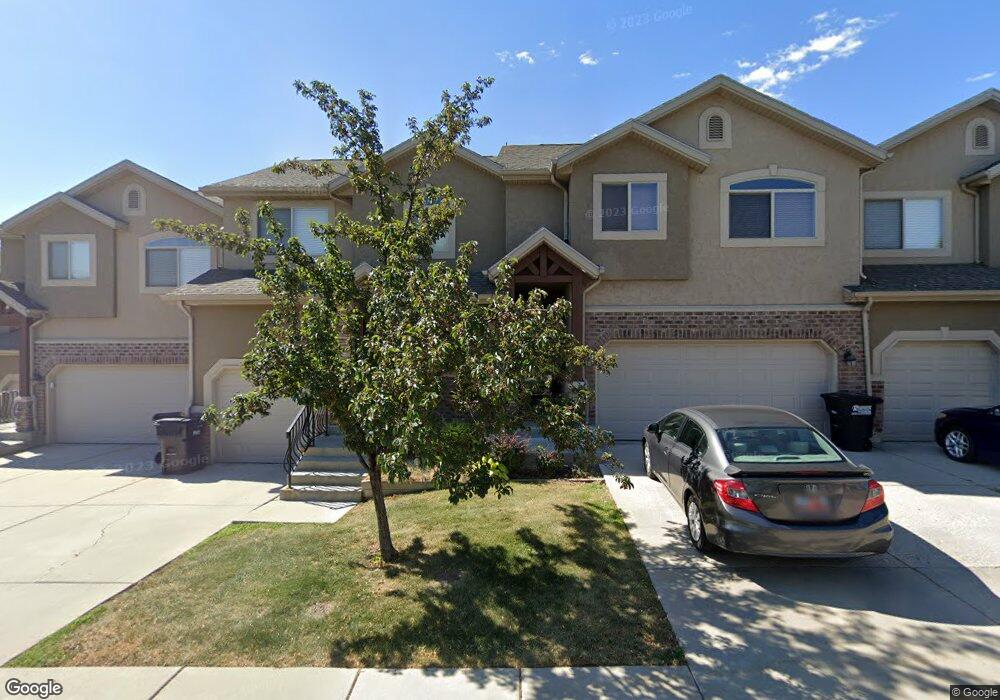
About This Home
This home is located at 1783 W 5050 S, Roy, UT 84067 and is currently estimated at $360,101, approximately $267 per square foot. 1783 W 5050 S is a home located in Weber County with nearby schools including Lakeview Elementary School, Roy Junior High School, and Roy High School.
Ownership History
Date
Name
Owned For
Owner Type
Purchase Details
Closed on
May 9, 2022
Sold by
Salisbury Jamie L
Bought by
Salisbury Jamie L and Salisbury Weston
Current Estimated Value
Purchase Details
Closed on
Sep 2, 2020
Sold by
Barker Jeremy L and Barker Darey
Bought by
Nilson Jamie L
Home Financials for this Owner
Home Financials are based on the most recent Mortgage that was taken out on this home.
Original Mortgage
$237,500
Interest Rate
3%
Mortgage Type
New Conventional
Purchase Details
Closed on
Jul 6, 2017
Sold by
Glover Justin
Bought by
Barker Jeremy L and Barker Darcy
Home Financials for this Owner
Home Financials are based on the most recent Mortgage that was taken out on this home.
Original Mortgage
$177,550
Interest Rate
3.95%
Mortgage Type
New Conventional
Purchase Details
Closed on
Jun 16, 2015
Sold by
Grandstaff David L
Bought by
Glover Justin
Home Financials for this Owner
Home Financials are based on the most recent Mortgage that was taken out on this home.
Original Mortgage
$163,440
Interest Rate
3.77%
Mortgage Type
VA
Purchase Details
Closed on
Aug 28, 2008
Sold by
Salmon Chad R
Bought by
Salmon Chad R
Home Financials for this Owner
Home Financials are based on the most recent Mortgage that was taken out on this home.
Original Mortgage
$150,350
Interest Rate
6.32%
Mortgage Type
Purchase Money Mortgage
Purchase Details
Closed on
Aug 14, 2008
Sold by
Stoney Brook Cotrtages Cs Llc
Bought by
Grandstaff David L and Grandstaff Jessica J
Home Financials for this Owner
Home Financials are based on the most recent Mortgage that was taken out on this home.
Original Mortgage
$150,350
Interest Rate
6.32%
Mortgage Type
Purchase Money Mortgage
Purchase Details
Closed on
Jul 28, 2008
Sold by
Salmon Chad R
Bought by
Salmon Chad R
Home Financials for this Owner
Home Financials are based on the most recent Mortgage that was taken out on this home.
Original Mortgage
$150,350
Interest Rate
6.32%
Mortgage Type
Purchase Money Mortgage
Purchase Details
Closed on
Feb 29, 2008
Sold by
Stoney Brook Cottages Jm Llc
Bought by
Stoney Brook Cottages Cs Llc
Purchase Details
Closed on
Aug 29, 2007
Sold by
Millburn Jed B
Bought by
Stoney Brook Cottages Cs Llc and Stoney Brook Cottages Jm Llc
Create a Home Valuation Report for This Property
The Home Valuation Report is an in-depth analysis detailing your home's value as well as a comparison with similar homes in the area
Home Values in the Area
Average Home Value in this Area
Purchase History
| Date | Buyer | Sale Price | Title Company |
|---|---|---|---|
| Salisbury Jamie L | -- | Stewart Title | |
| Nilson Jamie L | -- | Investors Title Ins Agency | |
| Barker Jeremy L | -- | None Available | |
| Glover Justin | -- | Hickman Land Title Co | |
| Salmon Chad R | -- | Founders Title | |
| Grandstaff David L | -- | Lincoln Title Ins Agency | |
| Salmon Chad R | -- | Accommodation | |
| Stoney Brook Cottages Cs Llc | -- | Lincoln Title Ins Agency | |
| Stoney Brook Cottages Cs Llc | -- | Founders Title Company Syrac |
Source: Public Records
Mortgage History
| Date | Status | Borrower | Loan Amount |
|---|---|---|---|
| Previous Owner | Nilson Jamie L | $237,500 | |
| Previous Owner | Barker Jeremy L | $177,550 | |
| Previous Owner | Glover Justin | $163,440 | |
| Previous Owner | Grandstaff David L | $150,350 |
Source: Public Records
Tax History
| Year | Tax Paid | Tax Assessment Tax Assessment Total Assessment is a certain percentage of the fair market value that is determined by local assessors to be the total taxable value of land and additions on the property. | Land | Improvement |
|---|---|---|---|---|
| 2025 | $1,907 | $336,330 | $90,000 | $246,330 |
| 2024 | $1,846 | $180,400 | $49,500 | $130,900 |
| 2023 | $1,865 | $182,600 | $49,500 | $133,100 |
| 2022 | $1,864 | $185,900 | $49,500 | $136,400 |
| 2021 | $1,603 | $265,000 | $35,000 | $230,000 |
| 2020 | $1,453 | $220,000 | $35,000 | $185,000 |
| 2019 | $1,434 | $205,000 | $30,000 | $175,000 |
| 2018 | $1,383 | $187,000 | $27,000 | $160,000 |
| 2017 | $1,272 | $162,000 | $27,000 | $135,000 |
| 2016 | $1,210 | $83,050 | $16,500 | $66,550 |
| 2015 | $1,173 | $83,050 | $16,500 | $66,550 |
| 2014 | $975 | $68,200 | $16,500 | $51,700 |
Source: Public Records
Map
Nearby Homes
- 1789 W 5050 S
- 1781 W 5050 S
- 1818 W 5050 S
- 1829 W 5050 S
- 1765 W 5000 S
- 1838 W 5050 S
- 5256 S 2000 W
- 4602 Hathaway Dr
- 4598 S Blossom Glen Way
- 5185 S 2100 W
- 5131 S 1275 W
- 4642 S 1900 W Unit 41
- 5124 S 1275 W
- 2038 W 4600 S
- 5125 S 1250 W
- 4963 S 2275 W
- 5243 S 2200 W
- 5261 S 2200 W
- 5289 S 2200 W
- 2015 W 4450 S
Your Personal Tour Guide
Ask me questions while you tour the home.