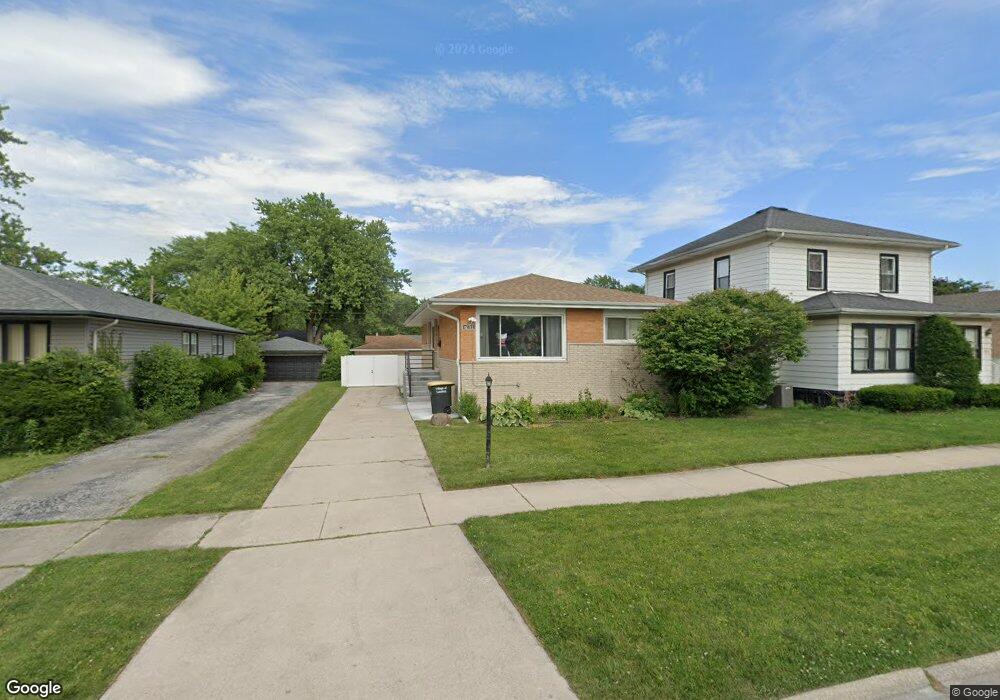
17831 Park Ave Lansing, IL 60438
Estimated Value: $190,918 - $204,000
3
Beds
2
Baths
1,170
Sq Ft
$170/Sq Ft
Est. Value
About This Home
This home is located at 17831 Park Ave, Lansing, IL 60438 and is currently estimated at $198,730, approximately $169 per square foot. 17831 Park Ave is a home located in Cook County with nearby schools including Coolidge Elementary School, Memorial Jr High School, and Thornton Fractnl So High School.
Ownership History
Date
Name
Owned For
Owner Type
Purchase Details
Closed on
Mar 28, 2013
Sold by
Secretary Of Hud Of Washington D C
Bought by
Mcclure Lianetta
Current Estimated Value
Purchase Details
Closed on
Nov 14, 2012
Sold by
Barlow Monique and Barlow Monique Y
Bought by
The Secretary Of Hud
Purchase Details
Closed on
Jul 3, 2003
Sold by
Kester Aaron R and Kester Sandra R
Bought by
Barlow Monique
Home Financials for this Owner
Home Financials are based on the most recent Mortgage that was taken out on this home.
Original Mortgage
$140,650
Interest Rate
5.37%
Mortgage Type
FHA
Create a Home Valuation Report for This Property
The Home Valuation Report is an in-depth analysis detailing your home's value as well as a comparison with similar homes in the area
Home Values in the Area
Average Home Value in this Area
Purchase History
| Date | Buyer | Sale Price | Title Company |
|---|---|---|---|
| Mcclure Lianetta | -- | Stewart Title Company | |
| The Secretary Of Hud | -- | None Available | |
| Barlow Monique | $135,000 | Git |
Source: Public Records
Mortgage History
| Date | Status | Borrower | Loan Amount |
|---|---|---|---|
| Previous Owner | Barlow Monique | $140,650 |
Source: Public Records
Tax History
| Year | Tax Paid | Tax Assessment Tax Assessment Total Assessment is a certain percentage of the fair market value that is determined by local assessors to be the total taxable value of land and additions on the property. | Land | Improvement |
|---|---|---|---|---|
| 2025 | $1,914 | $5,614 | $1,328 | $4,286 |
| 2024 | $1,914 | $5,614 | $1,328 | $4,286 |
| 2023 | $2,161 | $5,614 | $1,328 | $4,286 |
| 2022 | $2,161 | $5,036 | $1,172 | $3,864 |
| 2021 | $2,130 | $5,035 | $1,171 | $3,864 |
| 2020 | $2,044 | $5,035 | $1,171 | $3,864 |
| 2019 | $1,696 | $4,694 | $1,093 | $3,601 |
| 2018 | $1,663 | $4,694 | $1,093 | $3,601 |
| 2017 | $1,696 | $4,694 | $1,093 | $3,601 |
| 2016 | $1,895 | $4,715 | $1,015 | $3,700 |
| 2015 | $1,729 | $4,715 | $1,015 | $3,700 |
| 2014 | $1,719 | $4,715 | $1,015 | $3,700 |
| 2013 | $1,919 | $5,577 | $1,015 | $4,562 |
Source: Public Records
Map
Nearby Homes
- 17917 Lorenz Ave
- 17858 Ridgewood Ave
- 17714 Burnham Ave
- 17913 Oakwood Ave
- 2953 180th St
- 18019 Lorenz Ave
- 17831 Walter St
- 17855 Walter St
- 3238 178th St
- 17925 Walter St
- 18037 Ridgewood Ave
- 17926 Roy St
- 17821 Roy St
- 18006 Oakwood Ave
- 18034 Ridgewood Ave
- 17617 Burnham Ave
- 17946 Roy St
- 19510 Burnham Ave
- 17912 School St
- 17831 Community St
- 17831 Park Ave
- 17833 Park Ave
- 17821 Park Ave
- 17821 Park Ave
- 17837 Park Ave
- 17837 Park Ave
- 17817 Park Ave
- 17817 Park Ave
- 17841 Park Ave
- 17830 Lorenz Ave
- 17830 Lorenz Ave
- 17838 Lorenz Ave
- 17822 Lorenz Ave
- 17822 Lorenz Ave
- 17813 Park Ave
- 17813 Park Ave
- 17845 Park Ave
- 17845 Park Ave
- 17818 Lorenz Ave
- 17826 Park Ave
Your Personal Tour Guide
Ask me questions while you tour the home.