Estimated Value: $219,560 - $293,000
2
Beds
1
Bath
840
Sq Ft
$308/Sq Ft
Est. Value
About This Home
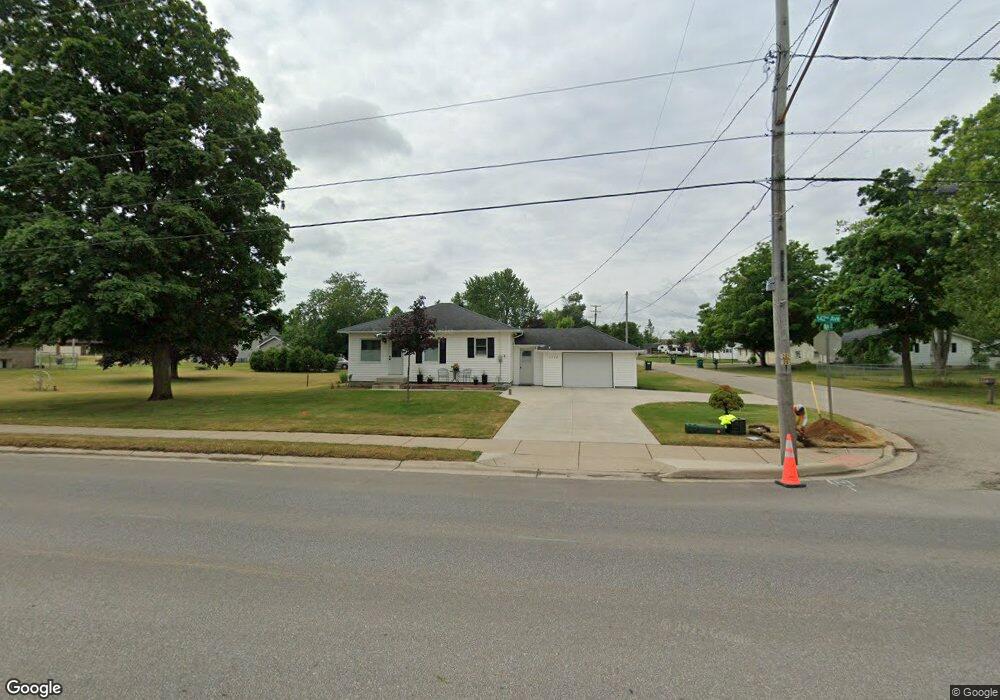
This home is located at 1784 142nd Ave, Dorr, MI 49323 and is currently estimated at $258,640, approximately $307 per square foot. 1784 142nd Ave is a home located in Allegan County with nearby schools including Wayland High School, St. Stanislaus School, and Moline Christian School.
Ownership History
Date
Name
Owned For
Owner Type
Purchase Details
Closed on
Nov 22, 2022
Sold by
Overzet Dale and Overzet Nancy
Bought by
Overzet Dale and Overzet Nancy
Current Estimated Value
Purchase Details
Closed on
Aug 26, 2015
Sold by
Vandam Kenneth and Vandam Lucille R
Bought by
Overzet Dale and Overzet Nancy L
Purchase Details
Closed on
Aug 1, 2013
Sold by
Livi Elzinga Michael and Livi James G Elzinga Revocable
Bought by
Van Dam Kenneth and Van Dam Lucille R
Purchase Details
Closed on
Feb 17, 2009
Sold by
Elzinga James G and Elzinga Lois E
Bought by
Trustee Of The James G Elzinga Revocable
Purchase Details
Closed on
Oct 27, 2008
Sold by
Slyker Bryan and Slyker Erika
Bought by
Elzinga James G
Home Financials for this Owner
Home Financials are based on the most recent Mortgage that was taken out on this home.
Original Mortgage
$70,000
Interest Rate
5.73%
Mortgage Type
Purchase Money Mortgage
Create a Home Valuation Report for This Property
The Home Valuation Report is an in-depth analysis detailing your home's value as well as a comparison with similar homes in the area
Home Values in the Area
Average Home Value in this Area
Purchase History
| Date | Buyer | Sale Price | Title Company |
|---|---|---|---|
| Overzet Dale | -- | None Listed On Document | |
| Overzet Dale | $112,500 | Calder Title Agency Llc | |
| Van Dam Kenneth | $35,000 | Lighthouse Title Inc | |
| Trustee Of The James G Elzinga Revocable | -- | None Available | |
| Elzinga James G | $87,500 | Transnation Title |
Source: Public Records
Mortgage History
| Date | Status | Borrower | Loan Amount |
|---|---|---|---|
| Previous Owner | Elzinga James G | $70,000 |
Source: Public Records
Tax History
| Year | Tax Paid | Tax Assessment Tax Assessment Total Assessment is a certain percentage of the fair market value that is determined by local assessors to be the total taxable value of land and additions on the property. | Land | Improvement |
|---|---|---|---|---|
| 2025 | $2,211 | $82,900 | $27,900 | $55,000 |
| 2024 | $2,059 | $74,200 | $24,400 | $49,800 |
| 2023 | $2,098 | $65,800 | $22,500 | $43,300 |
| 2022 | $2,059 | $58,400 | $20,200 | $38,200 |
| 2021 | $1,960 | $54,300 | $19,400 | $34,900 |
| 2020 | $522 | $52,100 | $18,500 | $33,600 |
| 2019 | $1,908 | $46,700 | $16,800 | $29,900 |
| 2018 | $1,959 | $48,100 | $14,300 | $33,800 |
| 2017 | $0 | $47,400 | $12,500 | $34,900 |
| 2016 | $0 | $44,400 | $12,500 | $31,900 |
| 2015 | -- | $44,400 | $12,500 | $31,900 |
| 2014 | -- | $40,100 | $13,000 | $27,100 |
| 2013 | -- | $38,300 | $13,000 | $25,300 |
Source: Public Records
Map
Nearby Homes
- 1341 142nd Ave
- Lots A&B 142nd Ave
- 4162 Radstock Dr
- 4221 Century Dr
- Lot 11 Walnut Dale Dr
- 4365 Chappel St
- 1232 Rosewood Ave
- 4273 Highpoint Dr Unit 112
- 4269 Highpoint Dr Unit 114
- 4271 Highpoint Dr Unit 113
- 4294 Highpoint Dr Unit 103
- 1069 Sunnyside Dr
- 4255 Cloverfield Ct
- 4279 Highpoint Dr
- 10780 Windward Ave SW
- 10785 Windward Ave SW
- Lot A 142nd Ave
- Lot B 142nd Ave
- 4243 Butternut Dr
- 4251 Butternut Dr
- 4191 Maple St
- 1331 142nd Ave
- 1780 142nd Ave
- 201 Po Box
- 4192 Maple St
- 1789 142nd Ave
- 4187 Maple St
- 1792 142nd Ave
- 4188 Hickory Rd
- 1793 142nd Ave
- 4186 Maple St
- 1796 142nd Ave
- 1795 142nd Ave
- 1783 142nd Ave Unit 83
- 1783 142nd Ave Unit 83
- 1778 142nd Ave
- 4185 Maple St
- 4184 Maple St
- 0 18th St Unit M13002727
- 0 18th St Unit M20038562
Your Personal Tour Guide
Ask me questions while you tour the home.