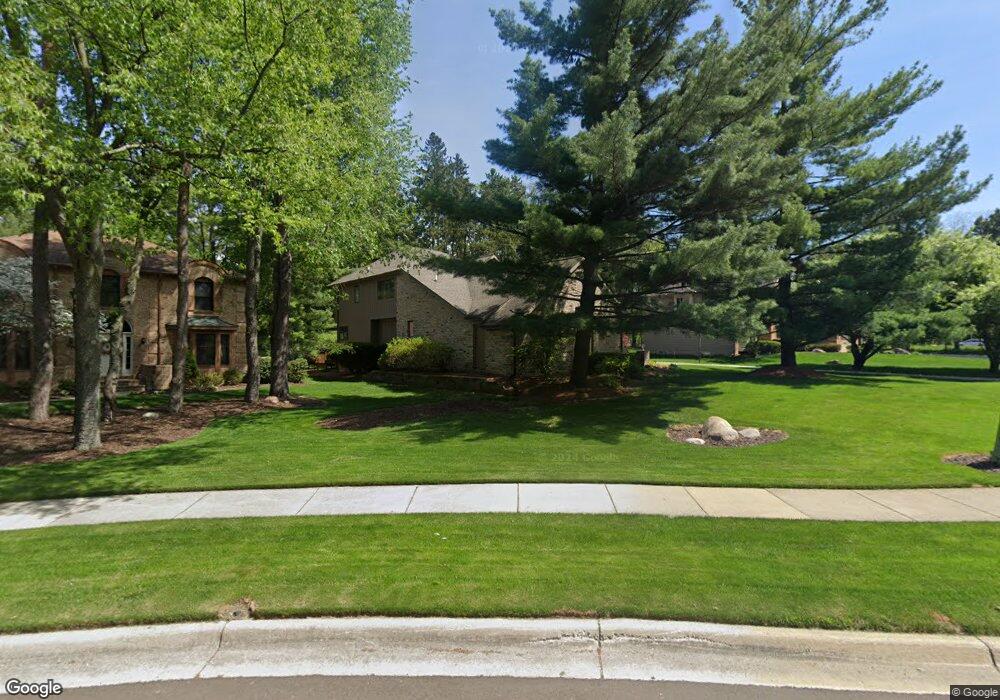
1784 Sashabaw Dr Okemos, MI 48864
Estimated Value: $635,000 - $714,000
4
Beds
5
Baths
3,747
Sq Ft
$179/Sq Ft
Est. Value
About This Home
This home is located at 1784 Sashabaw Dr, Okemos, MI 48864 and is currently estimated at $670,307, approximately $178 per square foot. 1784 Sashabaw Dr is a home located in Ingham County with nearby schools including Kinawa School, Hiawatha Elementary School, and Chippewa Middle School.
Ownership History
Date
Name
Owned For
Owner Type
Purchase Details
Closed on
Aug 23, 2022
Sold by
Shao Jianyi J and Shao Xiaokui M
Bought by
Youshao Family Trust
Current Estimated Value
Purchase Details
Closed on
Dec 5, 2003
Sold by
Bez Carol
Bought by
Shao Jianyi Jim and You Xiaokui Michelle
Home Financials for this Owner
Home Financials are based on the most recent Mortgage that was taken out on this home.
Original Mortgage
$322,700
Interest Rate
6.03%
Mortgage Type
Purchase Money Mortgage
Purchase Details
Closed on
Feb 26, 1999
Sold by
Bez Bert M and Bez Carol
Bought by
Bez Carol
Purchase Details
Closed on
Feb 26, 1998
Sold by
Bez Carol
Bought by
Bez Carol and Carol L Bez Trust
Purchase Details
Closed on
Jan 23, 1997
Sold by
Richardson Kurt A and Richardson Cynthia J
Bought by
Bez Bert M and Bez Carol
Purchase Details
Closed on
Mar 1, 1987
Create a Home Valuation Report for This Property
The Home Valuation Report is an in-depth analysis detailing your home's value as well as a comparison with similar homes in the area
Home Values in the Area
Average Home Value in this Area
Purchase History
| Date | Buyer | Sale Price | Title Company |
|---|---|---|---|
| Youshao Family Trust | -- | -- | |
| Shao Jianyi Jim | $480,000 | Midstate Title Co | |
| Bez Carol | -- | -- | |
| Bez Carol | -- | -- | |
| Bez Bert M | $350,000 | -- | |
| -- | $47,000 | -- |
Source: Public Records
Mortgage History
| Date | Status | Borrower | Loan Amount |
|---|---|---|---|
| Previous Owner | Shao Jianyi Jim | $322,700 | |
| Closed | Shao Jianyi Jim | $61,300 |
Source: Public Records
Tax History Compared to Growth
Tax History
| Year | Tax Paid | Tax Assessment Tax Assessment Total Assessment is a certain percentage of the fair market value that is determined by local assessors to be the total taxable value of land and additions on the property. | Land | Improvement |
|---|---|---|---|---|
| 2025 | $12,856 | $318,100 | $37,700 | $280,400 |
| 2024 | $56 | $304,700 | $37,200 | $267,500 |
| 2023 | $12,092 | $275,200 | $36,700 | $238,500 |
| 2022 | $11,500 | $257,400 | $36,200 | $221,200 |
| 2021 | $11,274 | $247,100 | $33,500 | $213,600 |
| 2020 | $11,126 | $260,100 | $33,500 | $226,600 |
| 2019 | $10,461 | $259,300 | $32,200 | $227,100 |
| 2018 | $9,915 | $253,000 | $26,700 | $226,300 |
| 2017 | $9,498 | $241,200 | $29,200 | $212,000 |
| 2016 | $4,194 | $224,600 | $28,700 | $195,900 |
| 2015 | $4,194 | $205,100 | $51,968 | $153,132 |
| 2014 | $4,194 | $187,600 | $52,467 | $135,133 |
Source: Public Records
Map
Nearby Homes
- 3826 Pine Knoll Dr
- 3745 Dobie Rd
- 3890 Pine Knoll Dr
- 3921 Dobie Rd
- 3614 Breezy Point Dr
- 3624 W Arbutus Dr
- 1995 Belwood Dr
- 3660 Powderhorn Dr
- 3555 Breezy Point Dr
- 2024 Belwood Dr
- 2020 Tamarack Dr
- 1591 Wenonah Dr
- 3740 Cavalier Dr Unit 2
- 2073 Birch Bluff Dr
- 3588 Autumnwood Ln
- 3675 E Meadows Ct Unit 58
- 2083 Fox Hollow Dr
- 1420 Ambassador Dr
- 2150 Heritage Ave
- 3633 E Meadows Ct
- 1790 Sashabaw Dr
- 1772 Sashabaw Dr
- 3831 Pine Knoll Dr
- 1688 Yosemite Dr
- 1779 Sashabaw Dr
- 3837 Pine Knoll Dr
- 1791 Sashabaw Dr
- 1785 Yosemite Dr
- 1798 Sashabaw Dr
- 1771 Sashabaw Dr
- 1792 Yosete
- 1795 Sashabaw Dr
- 0 Yosemite Dr Unit 9
- 0 Yosemite Dr Unit 193121
- 0 Yosemite Dr Unit 36105
- 0 Yosemite Dr Unit 36107
- 0 Yosemite Dr Unit 43037
- 3841 Pine Knoll Dr
- 1792 Yosemite Dr