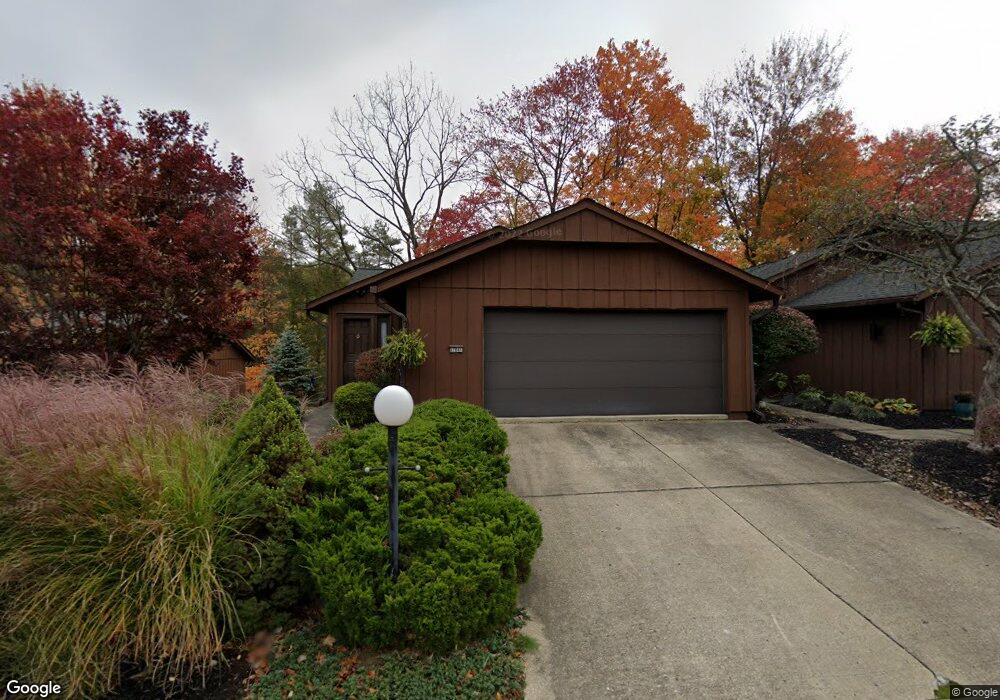
17841 Cliffside Dr Strongsville, OH 44136
Estimated Value: $258,000 - $328,000
2
Beds
3
Baths
1,808
Sq Ft
$166/Sq Ft
Est. Value
About This Home
This home is located at 17841 Cliffside Dr, Strongsville, OH 44136 and is currently estimated at $299,534, approximately $165 per square foot. 17841 Cliffside Dr is a home located in Cuyahoga County with nearby schools including Strongsville High School, Sts Joseph & John Interparochial School, and Royal Redeemer Lutheran School.
Ownership History
Date
Name
Owned For
Owner Type
Purchase Details
Closed on
Feb 28, 2014
Sold by
Kulig John J
Bought by
Kulig John J and Kolman Rose
Current Estimated Value
Purchase Details
Closed on
Sep 25, 2003
Sold by
Kulig John J
Bought by
Kulig John J and John J Kulig Living Trust
Purchase Details
Closed on
Jan 22, 1999
Sold by
Estate Of Barbara Kulic
Bought by
Kulig John J
Purchase Details
Closed on
Jun 23, 1989
Sold by
Kulig John
Bought by
Kulig Barbara
Purchase Details
Closed on
Sep 12, 1988
Sold by
Sharon Martin J and Sharon Sweeney
Bought by
Kulig John
Purchase Details
Closed on
Dec 8, 1981
Sold by
Saunders Wayne
Bought by
Sharon Martin J and Sharon Sweeney
Purchase Details
Closed on
Sep 25, 1981
Sold by
Dagnan Timothy J
Bought by
Saunders Wayne
Purchase Details
Closed on
Mar 5, 1981
Bought by
Title Guarantee & Trust
Purchase Details
Closed on
Feb 17, 1981
Bought by
Bob Schmitt Homes Inc
Purchase Details
Closed on
Jan 1, 1977
Bought by
Title Guarantee & Trust Co
Create a Home Valuation Report for This Property
The Home Valuation Report is an in-depth analysis detailing your home's value as well as a comparison with similar homes in the area
Home Values in the Area
Average Home Value in this Area
Purchase History
| Date | Buyer | Sale Price | Title Company |
|---|---|---|---|
| Kulig John J | -- | Attorney | |
| Kulig John J | -- | -- | |
| Kulig John J | -- | -- | |
| Kulig Barbara | -- | -- | |
| Kulig John | $108,000 | -- | |
| Sharon Martin J | -- | -- | |
| Saunders Wayne | $86,000 | -- | |
| Dagnan Timothy J | -- | -- | |
| Title Guarantee & Trust | -- | -- | |
| Bob Schmitt Homes Inc | -- | -- | |
| Title Guarantee & Trust Co | -- | -- |
Source: Public Records
Tax History Compared to Growth
Tax History
| Year | Tax Paid | Tax Assessment Tax Assessment Total Assessment is a certain percentage of the fair market value that is determined by local assessors to be the total taxable value of land and additions on the property. | Land | Improvement |
|---|---|---|---|---|
| 2024 | $3,549 | $85,400 | $9,170 | $76,230 |
| 2023 | $3,682 | $67,970 | $6,790 | $61,180 |
| 2022 | $3,681 | $67,970 | $6,790 | $61,180 |
| 2021 | $3,652 | $67,970 | $6,790 | $61,180 |
| 2020 | $2,979 | $51,490 | $5,150 | $46,340 |
| 2019 | $2,892 | $147,100 | $14,700 | $132,400 |
| 2018 | $3,162 | $51,490 | $5,150 | $46,340 |
| 2017 | $2,535 | $38,220 | $3,850 | $34,370 |
| 2016 | $2,515 | $38,220 | $3,850 | $34,370 |
| 2015 | $2,158 | $38,220 | $3,850 | $34,370 |
| 2014 | $2,158 | $41,090 | $4,130 | $36,960 |
Source: Public Records
Map
Nearby Homes
- 17809 Cliffside Dr Unit 4926
- 17945 Cliffside Dr
- 18248 Meadow Ln
- 18336 Falling Water Rd
- 12101 The Bluffs
- 17289 Akita Ct Unit 4508
- 11650 River Moss Rd
- 17281 Akita Ct Unit 4506
- 13513 Suncrest Ct
- 11479 Pearl Rd Unit A101
- 11499 Pearl Rd Unit A106
- 11432 Pearl Rd
- 13099 Olympus Way
- 13066 Olympus Way
- 13156 Olympus Way
- 12539 Olympus Way
- 16519 Albion Rd
- 19160 Wheelers Ln
- 19240 Briarwood Ln
- 12385 Corinth Ct
- 17842 Hollowrun Place Unit 4915
- 17844 Hollowrun Place Unit 4916
- 17844 Hollowrun Place
- 17846 Hollowrun Place Unit 4917
- 17848 Hollowrun Place Unit 4918
- 17934 Cliffside Dr Unit 4914
- 17843 Hollowrun Place Unit 4921
- 17873 Cliffside Dr Unit 4933
- 17845 Hollowrun Place
- 17833 Cliffside Dr Unit 4929
- 17849 Hollowrun Place Unit 4919
- 17829 Cliffside Dr Unit 4928
- 18018 Bonnie Ln
- 17925 Cliffside Dr Unit 4938
- 17895 Cliffside Dr
- 17895 Cliffside Dr Unit 4935
- 17911 Cliffside Dr
- 17817 Cliffside Dr
- 17933 Cliffside Dr
- 17809 Cliffside Dr Unit 4925