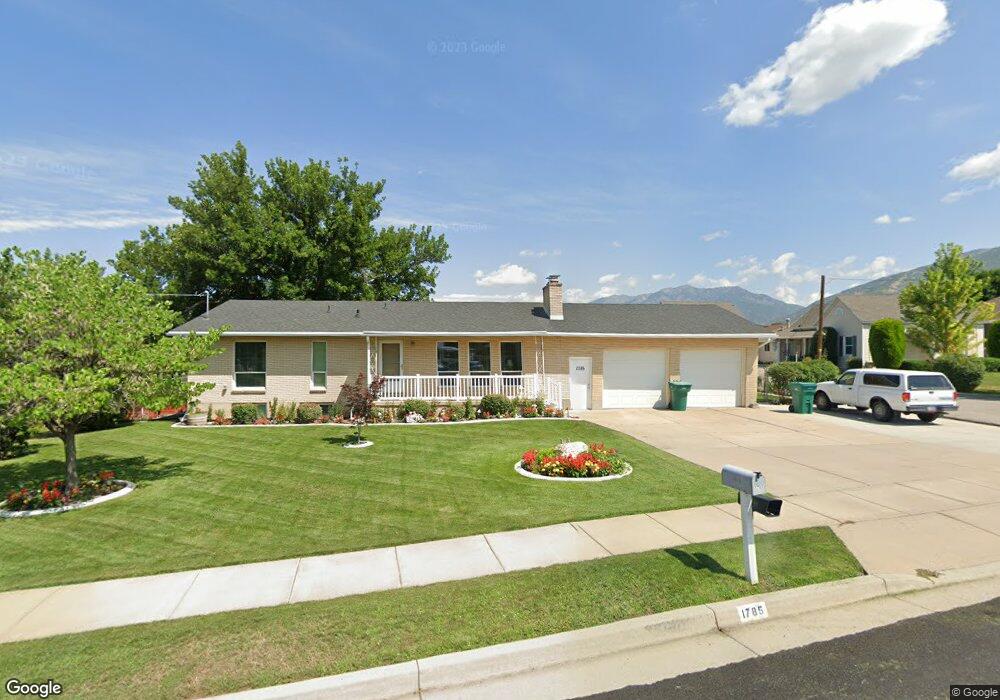
1785 E Cherry Ln Layton, UT 84040
Estimated Value: $493,000 - $568,000
5
Beds
3
Baths
2,520
Sq Ft
$209/Sq Ft
Est. Value
About This Home
This home is located at 1785 E Cherry Ln, Layton, UT 84040 and is currently estimated at $526,901, approximately $209 per square foot. 1785 E Cherry Ln is a home located in Davis County with nearby schools including East Layton Elementary School, Central Davis Junior High School, and Layton High School.
Ownership History
Date
Name
Owned For
Owner Type
Purchase Details
Closed on
Jan 6, 2021
Sold by
Batty Linda M and Rhoades Renee
Bought by
Batty Linda M and Rhoades Renne
Current Estimated Value
Home Financials for this Owner
Home Financials are based on the most recent Mortgage that was taken out on this home.
Original Mortgage
$133,500
Outstanding Balance
$118,855
Interest Rate
2.7%
Mortgage Type
New Conventional
Estimated Equity
$408,046
Purchase Details
Closed on
Dec 28, 2016
Sold by
Batty Linda M and Rhoades Renee
Bought by
Batty Linda M and Rhoades Renee
Purchase Details
Closed on
Sep 16, 2008
Sold by
Richmond James and Richmond Karla C
Bought by
Batty Linda M
Home Financials for this Owner
Home Financials are based on the most recent Mortgage that was taken out on this home.
Original Mortgage
$186,603
Interest Rate
6.51%
Mortgage Type
FHA
Purchase Details
Closed on
Aug 8, 2007
Sold by
Richmond James O and Richmond Karla C
Bought by
Richmond James and Richmond Karla C
Purchase Details
Closed on
Aug 19, 2005
Sold by
Blyschak Kimberly Elizabeth R
Bought by
Richmond James O and Richmond Karla C
Home Financials for this Owner
Home Financials are based on the most recent Mortgage that was taken out on this home.
Original Mortgage
$65,750
Interest Rate
5.61%
Mortgage Type
Fannie Mae Freddie Mac
Purchase Details
Closed on
Aug 18, 2005
Sold by
Richmond Christian L
Bought by
Richmond James O and Richmond Karla C
Home Financials for this Owner
Home Financials are based on the most recent Mortgage that was taken out on this home.
Original Mortgage
$65,750
Interest Rate
5.61%
Mortgage Type
Fannie Mae Freddie Mac
Purchase Details
Closed on
Aug 16, 2005
Sold by
Richmond James O and Richmond Karla C
Bought by
Richmond James O and Richmond Karla C
Home Financials for this Owner
Home Financials are based on the most recent Mortgage that was taken out on this home.
Original Mortgage
$65,750
Interest Rate
5.61%
Mortgage Type
Fannie Mae Freddie Mac
Purchase Details
Closed on
Jul 7, 2005
Sold by
Richmond Mark A
Bought by
Richmond James and Richmond Karla C
Home Financials for this Owner
Home Financials are based on the most recent Mortgage that was taken out on this home.
Original Mortgage
$65,750
Interest Rate
5.61%
Mortgage Type
Fannie Mae Freddie Mac
Purchase Details
Closed on
May 29, 2003
Sold by
Richmond James R and Richmond Karla C
Bought by
Richmond Mark A and Richmond Christian L
Create a Home Valuation Report for This Property
The Home Valuation Report is an in-depth analysis detailing your home's value as well as a comparison with similar homes in the area
Home Values in the Area
Average Home Value in this Area
Purchase History
| Date | Buyer | Sale Price | Title Company |
|---|---|---|---|
| Batty Linda M | -- | Mountain View Title & E | |
| Batty Linda M | -- | Old Republic Natl Title | |
| Batty Linda M | -- | First American Title | |
| Richmond James | -- | None Available | |
| Richmond James O | -- | Backman Title Services | |
| Richmond James O | -- | Backman Title Services | |
| Richmond James O | -- | Backman Title Services | |
| Richmond James O | -- | Backman Title Services | |
| Richmond James | -- | Backman Title Services | |
| Richmond Mark A | -- | -- |
Source: Public Records
Mortgage History
| Date | Status | Borrower | Loan Amount |
|---|---|---|---|
| Open | Batty Linda M | $133,500 | |
| Closed | Batty Linda M | $186,603 | |
| Previous Owner | Richmond James O | $65,750 | |
| Previous Owner | Richmond James O | $65,750 | |
| Previous Owner | Richmond James O | $65,750 | |
| Previous Owner | Richmond James | $65,750 |
Source: Public Records
Tax History
| Year | Tax Paid | Tax Assessment Tax Assessment Total Assessment is a certain percentage of the fair market value that is determined by local assessors to be the total taxable value of land and additions on the property. | Land | Improvement |
|---|---|---|---|---|
| 2025 | $2,594 | $272,250 | $126,524 | $145,726 |
| 2024 | $2,455 | $259,601 | $150,002 | $109,599 |
| 2023 | $2,425 | $452,000 | $201,486 | $250,514 |
| 2022 | $2,467 | $249,700 | $108,144 | $141,556 |
| 2021 | $2,378 | $359,000 | $164,692 | $194,308 |
| 2020 | $2,037 | $295,000 | $133,778 | $161,222 |
| 2019 | $2,101 | $298,000 | $119,412 | $178,588 |
| 2018 | $1,952 | $278,000 | $93,287 | $184,713 |
| 2016 | $1,703 | $125,070 | $49,032 | $76,038 |
| 2015 | $1,582 | $110,330 | $49,032 | $61,298 |
| 2014 | $1,749 | $124,673 | $49,032 | $75,641 |
| 2013 | -- | $99,832 | $31,020 | $68,812 |
Source: Public Records
Map
Nearby Homes
- 1975 E 1425 N
- 1843 Hayes Dr
- 2124 E Cherry Ln
- 2113 E 1200 N
- 1476 Kays Creek Dr
- 1350 Kays Creek Dr
- 1354 E Hollyhock Way
- 1340 E Hollyhock Way
- 1540 E Primrose Ln
- 1960 N 2150 E
- 1907 N Bridge Ct
- 1258 E North Lisa St
- 1465 E Sego Lily Ct
- 1332 N 2350 E
- 1545 E 975 N
- 2391 Kays Creek Dr
- 1305 E Larkspur Way
- 1266 E Larkspur Way
- 2096 N 1450 E
- 2189 N 1950 E
- 1813 E Cherry Ln
- 1763 E Cherry Ln
- 1828 E Cherry Ln
- 1810 E Cherry Ln
- 1846 E Cherry Ln
- 1825 E Cherry Ln
- 1751 Hillsboro Dr
- 1743 Hillsboro Dr
- 1485 Child Dr
- 1752 E Cherry Ln
- 1819 Crestwood Rd
- 1727 Hillsboro Dr
- 1843 Crestwood Rd
- 1845 E Cherry Ln
- 1803 Crestwood Rd
- 1463 N 1875 E
- 1463 Child Dr
- 1715 Hillsboro Dr
- 1785 E Crestwood St
- 1785 Crestwood Rd
Your Personal Tour Guide
Ask me questions while you tour the home.