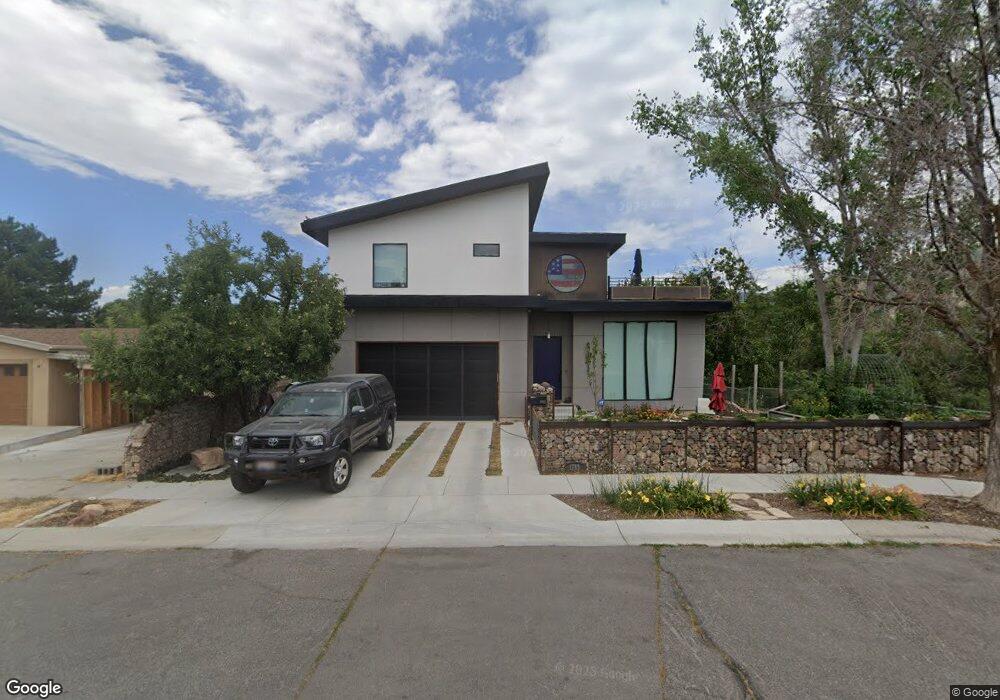
1785 E Rosecrest Dr Salt Lake City, UT 84108
Wasatch Hollow NeighborhoodEstimated Value: $1,264,000 - $1,675,379
6
Beds
5
Baths
2,600
Sq Ft
$550/Sq Ft
Est. Value
About This Home
This home is located at 1785 E Rosecrest Dr, Salt Lake City, UT 84108 and is currently estimated at $1,431,095, approximately $550 per square foot. 1785 E Rosecrest Dr is a home located in Salt Lake County with nearby schools including Bonneville School, Clayton Middle School, and East High School.
Ownership History
Date
Name
Owned For
Owner Type
Purchase Details
Closed on
Aug 4, 2016
Sold by
Condit Thomas and Condit Dalton R
Bought by
Alston Spencer B
Current Estimated Value
Purchase Details
Closed on
Aug 20, 2013
Sold by
Condit Thomas S and Condit Dalton C
Bought by
Condit Thomas C and Condit Dalton R
Purchase Details
Closed on
Jun 16, 2010
Sold by
Condit Thomas S
Bought by
Condit Thomas S and Condit Michael B
Purchase Details
Closed on
Jun 1, 2010
Sold by
Deutsche Bank National Trust Company
Bought by
Condit Thomas S
Purchase Details
Closed on
Mar 11, 2010
Sold by
Allbright Magdalena
Bought by
Deutsche Bank National Trust Company
Purchase Details
Closed on
Sep 12, 2006
Sold by
Garrett Florence A B
Bought by
Allbright Magdalena
Home Financials for this Owner
Home Financials are based on the most recent Mortgage that was taken out on this home.
Original Mortgage
$212,000
Interest Rate
6.56%
Mortgage Type
Unknown
Create a Home Valuation Report for This Property
The Home Valuation Report is an in-depth analysis detailing your home's value as well as a comparison with similar homes in the area
Home Values in the Area
Average Home Value in this Area
Purchase History
| Date | Buyer | Sale Price | Title Company |
|---|---|---|---|
| Alston Spencer B | -- | Backman Title Services | |
| Condit Thomas C | -- | Accommodation | |
| Condit Thomas S | -- | Accommodation | |
| Condit Thomas S | -- | Premier Title Ins Agency | |
| Deutsche Bank National Trust Company | $230,466 | Inwest Title Services | |
| Allbright Magdalena | -- | Bonneville Superior Title |
Source: Public Records
Mortgage History
| Date | Status | Borrower | Loan Amount |
|---|---|---|---|
| Previous Owner | Allbright Magdalena | $212,000 |
Source: Public Records
Tax History Compared to Growth
Tax History
| Year | Tax Paid | Tax Assessment Tax Assessment Total Assessment is a certain percentage of the fair market value that is determined by local assessors to be the total taxable value of land and additions on the property. | Land | Improvement |
|---|---|---|---|---|
| 2025 | $7,268 | $1,542,000 | $392,200 | $1,149,800 |
| 2024 | $7,268 | $1,386,800 | $267,300 | $1,119,500 |
| 2023 | $7,241 | $1,331,700 | $257,100 | $1,074,600 |
| 2022 | $7,513 | $1,296,400 | $252,000 | $1,044,400 |
| 2021 | $7,212 | $1,126,700 | $204,600 | $922,100 |
| 2020 | $6,789 | $1,009,600 | $141,100 | $868,500 |
| 2019 | $1,756 | $135,100 | $135,100 | $0 |
| 2018 | $2,840 | $386,900 | $135,100 | $251,800 |
| 2017 | $2,784 | $355,300 | $135,100 | $220,200 |
| 2016 | $2,054 | $249,000 | $135,100 | $113,900 |
| 2015 | $1,892 | $217,400 | $140,500 | $76,900 |
| 2014 | $1,707 | $194,500 | $132,400 | $62,100 |
Source: Public Records
Map
Nearby Homes
- 1662 E Browning Ave
- 1368 S 1700 E
- 1540 Preston St
- 1433 S 1600 E
- 1583 S 1900 E
- 1603 S 1600 E
- 1962 E Janet Kay Ln S
- 1219 S 1800 E
- 1733 Sugarhouse Ln
- 1970 Logan Ave S
- 1478 E Roosevelt Ave
- 2023 E 1700 S
- 1644 E Princeton Ave
- 1525 E 1700 S
- 2008 E Laird Dr
- 1608 S 1500 E
- 1726 E Downington Ave
- 1791 S 1600 E
- 1726 E Yale Ave
- 1232 S 1500 E
- 1785 Rosecrest Dr
- 1769 E Rosecrest Dr
- 1769 E Rosecrest Dr
- 1476 S 1800 E
- 1756 E Rosecrest Dr
- 1756 Rosecrest Dr
- 1486 S 1800 E
- 1759 Rosecrest Dr
- 1752 E Rosecrest Dr
- 1752 Rosecrest Dr
- 1751 Rosecrest Dr
- 1751 E Rosecrest Dr
- 1496 S 1800 E
- 1743 E Rosecrest Dr
- 1743 E Rosecrest Dr
- 1748 Rosecrest Dr
- 1748 Browning Ave
- 1504 S 1800 E
- 1752 E Browning Ave
- 1744 E Rosecrest Dr