
1785 Kimberly Rd SW Atlanta, GA 30331
Estimated payment $13,800/month
About This Lot
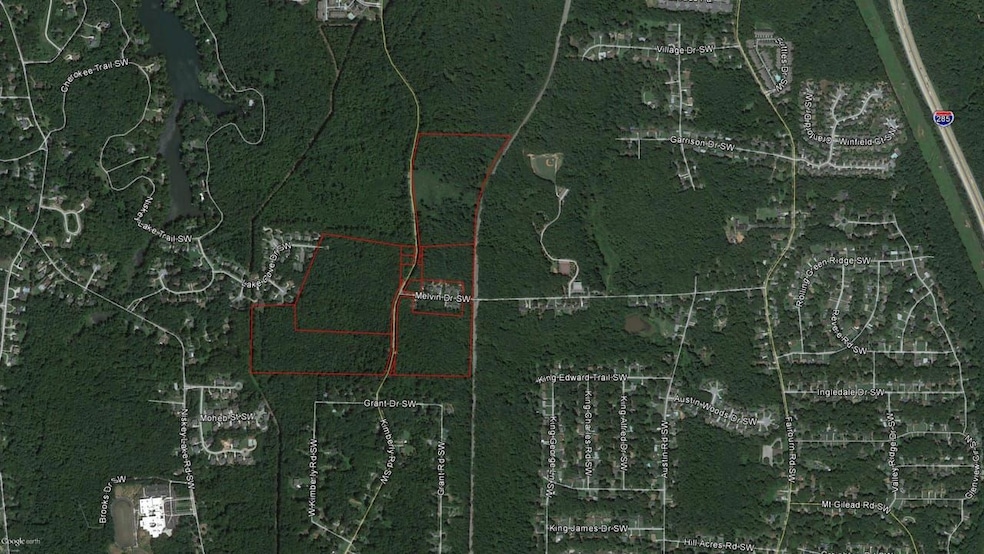
We exclusively present 93.18 acres planned for 248 single-family detached lots on Kimberly Road SW (The Property), northwest of the I-285/Cascade Road intersection in Fulton County, Georgia.
The Property offers the following:
Excellent location with convenient access to Interstate 285, Interstate 85 and Downtown Atlanta.
Located less than eight miles from Hartsfield-Jackson International Airport, the world's busiest airport that employs more than 63,000 people.
Easy access to more than 1.2 million square feet of retail, restaurants and other commercial amenities along the Camp Creek Parkway commercial corridor and Cascade Road corridor.
Sales of 886 newly constructed single-family detached houses through 3Q19 in the South Fulton Housing Market (South of I-20). The average price of these houses was $256,000.
Zoned PD-H (Single-Family or Multi-Family) in the City of Atlanta.
Planned for 248 single-family detached lots in five different entrances/subdivisions which will allow a developer/builder to phase the development over a number of years and have distinguished price points to increase absorption.

Property Details
Property Type
- Land
Est. Annual Taxes
- $3,759
Lot Details
- Current uses include commercial
- Potential uses include for development
Map
Home Values in the Area
Average Home Value in this Area
Tax History
| Year | Tax Paid | Tax Assessment Tax Assessment Total Assessment is a certain percentage of the fair market value that is determined by local assessors to be the total taxable value of land and additions on the property. | Land | Improvement |
|---|---|---|---|---|
| 2025 | $3,759 | $149,120 | $149,120 | -- |
| 2023 | $4,879 | $117,840 | $117,840 | $0 |
| 2022 | $1,693 | $141,480 | $141,480 | $0 |
| 2021 | $1,695 | $41,840 | $41,840 | $0 |
| 2020 | $1,714 | $41,840 | $41,840 | $0 |
| 2019 | $456 | $41,840 | $41,840 | $0 |
| 2018 | $629 | $41,840 | $41,840 | $0 |
| 2017 | $657 | $15,200 | $15,200 | $0 |
| 2016 | $658 | $15,200 | $15,200 | $0 |
| 2015 | $874 | $15,200 | $15,200 | $0 |
| 2014 | $689 | $15,200 | $15,200 | $0 |
Property History
| Date | Event | Price | Change | Sq Ft Price |
|---|---|---|---|---|
| 04/27/2022 04/27/22 | For Sale | $2,480,000 | -- | -- |
- 1811 Lake Cove Dr SW
- 4002 Moheb St SW
- 4054 Lyon Blvd SW
- 4025 Gretna Dr
- 1898 W Kimberly Rd SW
- 1908 W Kimberly Rd SW
- 4021 Melvin Dr SW
- 2654 Niskey Lake Rd SW
- 4040 Annecy Dr SW
- 1825 Niskey Lake Rd SW
- 4070 Annecy Dr SW
- 1941 Kimberly Rd SW
- 1960 Niskey Lake Rd SW
- 1989 Grant Rd SW
- 1973 Niskey Lake Rd SW
- 4064 Sunset Dr SW
- 4122 Sunset Dr SW
- 1887 King Charles Rd SW
- 4178 Wellpointe Cir SW
- 4172 Wellpointe Cir SW
- 1918 W Kimberly Rd SW
- 3873 King Edward Trail SW
- 2122 Kimberly Rd SW
- 4005 Campbellton Rd SW
- 4037 Braxton Place SW
- 3901 Campbellton Rd SW
- 4261 Notting Hill Dr SW
- 2175 Fairburn Rd SW
- 4270 Notting Hill Dr SW
- 750 Legacy Place SW
- 6300 Suttles Dr SW
- 1480 Loch Lomond Trail SW
- 2309 Omaha Rd SW
- 4442 Creek Valley Ct SW
- 1225 Fairburn Rd SW
- 4197 Danforth Rd SW
- 2534 Niskey Lake Rd SW
- 470 Piney Way SW
- 3457 Dale Ln SW
- 2215 Fairway Cir SW