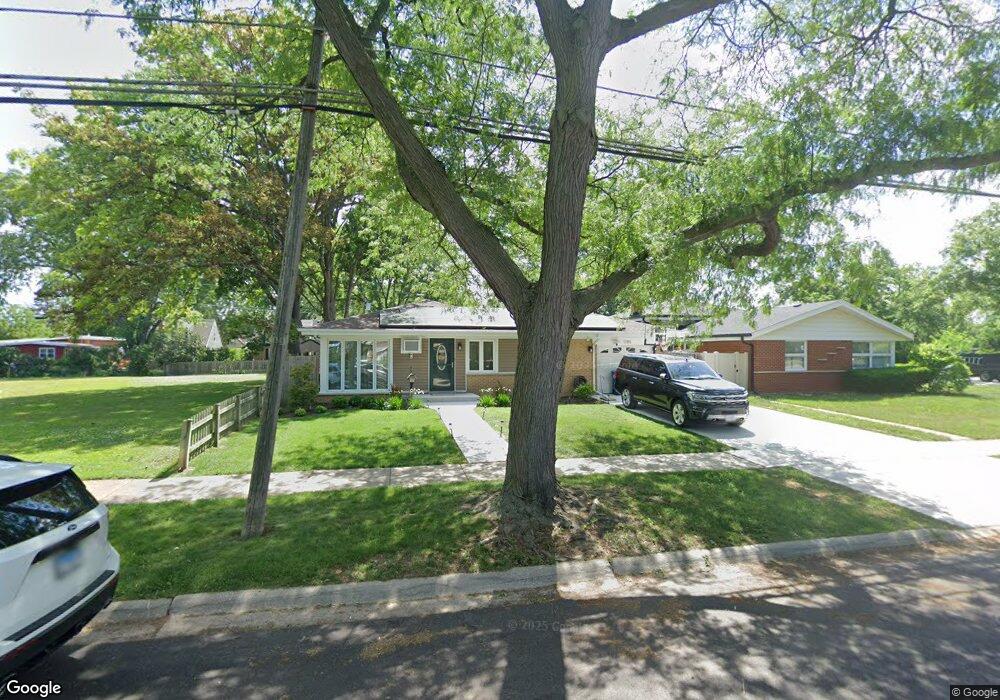
1785 Maple St Des Plaines, IL 60018
Estimated Value: $365,000 - $460,000
3
Beds
1
Bath
1,599
Sq Ft
$253/Sq Ft
Est. Value
About This Home
This home is located at 1785 Maple St, Des Plaines, IL 60018 and is currently estimated at $405,074, approximately $253 per square foot. 1785 Maple St is a home located in Cook County with nearby schools including South Elementary School, Algonquin Middle School, and Maine West High School.
Ownership History
Date
Name
Owned For
Owner Type
Purchase Details
Closed on
Mar 20, 2004
Sold by
Hernandez Harry and Hernandez Danielle
Bought by
Hernandez Harry and Hernandez Danielle
Current Estimated Value
Purchase Details
Closed on
Jun 30, 2003
Sold by
Effie Sherios William and Effie Sherios
Bought by
Hernandez Harry and Hernandez Danielle
Home Financials for this Owner
Home Financials are based on the most recent Mortgage that was taken out on this home.
Original Mortgage
$234,400
Interest Rate
6.44%
Mortgage Type
Unknown
Create a Home Valuation Report for This Property
The Home Valuation Report is an in-depth analysis detailing your home's value as well as a comparison with similar homes in the area
Home Values in the Area
Average Home Value in this Area
Purchase History
| Date | Buyer | Sale Price | Title Company |
|---|---|---|---|
| Hernandez Harry | -- | -- | |
| Hernandez Harry | $293,000 | Pntn |
Source: Public Records
Mortgage History
| Date | Status | Borrower | Loan Amount |
|---|---|---|---|
| Previous Owner | Hernandez Harry | $234,400 |
Source: Public Records
Tax History Compared to Growth
Tax History
| Year | Tax Paid | Tax Assessment Tax Assessment Total Assessment is a certain percentage of the fair market value that is determined by local assessors to be the total taxable value of land and additions on the property. | Land | Improvement |
|---|---|---|---|---|
| 2025 | $6,508 | $35,001 | $6,881 | $28,120 |
| 2024 | $6,508 | $28,000 | $5,734 | $22,266 |
| 2023 | $6,324 | $28,000 | $5,734 | $22,266 |
| 2022 | $6,324 | $28,000 | $5,734 | $22,266 |
| 2021 | $7,051 | $26,268 | $4,778 | $21,490 |
| 2020 | $7,526 | $28,008 | $4,778 | $23,230 |
| 2019 | $7,546 | $31,470 | $4,778 | $26,692 |
| 2018 | $6,055 | $23,683 | $4,204 | $19,479 |
| 2017 | $5,966 | $23,683 | $4,204 | $19,479 |
| 2016 | $5,887 | $23,683 | $4,204 | $19,479 |
| 2015 | $6,107 | $22,824 | $3,631 | $19,193 |
| 2014 | $5,994 | $22,824 | $3,631 | $19,193 |
| 2013 | $5,828 | $22,824 | $3,631 | $19,193 |
Source: Public Records
Map
Nearby Homes
- 1845 Everett Ave
- 1721 Prospect Ave
- 1640 S River Rd
- 1980 Howard Ave
- 1754 E Lincoln Ave
- 1864 Illinois St
- 1689 S Elm St
- 1445 Everett Ave
- 1696 S Elm St
- 1700 E Forest Ave
- 1278 E River Dr
- 2091 Sherwin Ave
- 1673 Spruce Ave
- 1783 Lee St
- 1939 E Touhy Ave
- 1489 E Algonquin Rd
- 1641 E Touhy Ave
- 1629 E Touhy Ave
- 2500 Maple St
- 38 E Touhy Ave
- 1810 Everett Ave
- 1784 Locust St
- 1774 Locust St
- 1844 Everett Ave
- 1766 Locust St
- 1811 Everett Ave
- 1776 Maple St
- 1786 Maple St
- 1758 Locust St
- 1770 Maple St
- 1784 Everett Ave
- 1784 Everett Ave
- 1760 Maple St
- 1750 Locust St
- 1823 Maple St Unit 305
- 1823 Maple St
- 1752 Maple St
- 1737 Maple St
- 1808 Maple St
- 1820 Locust St