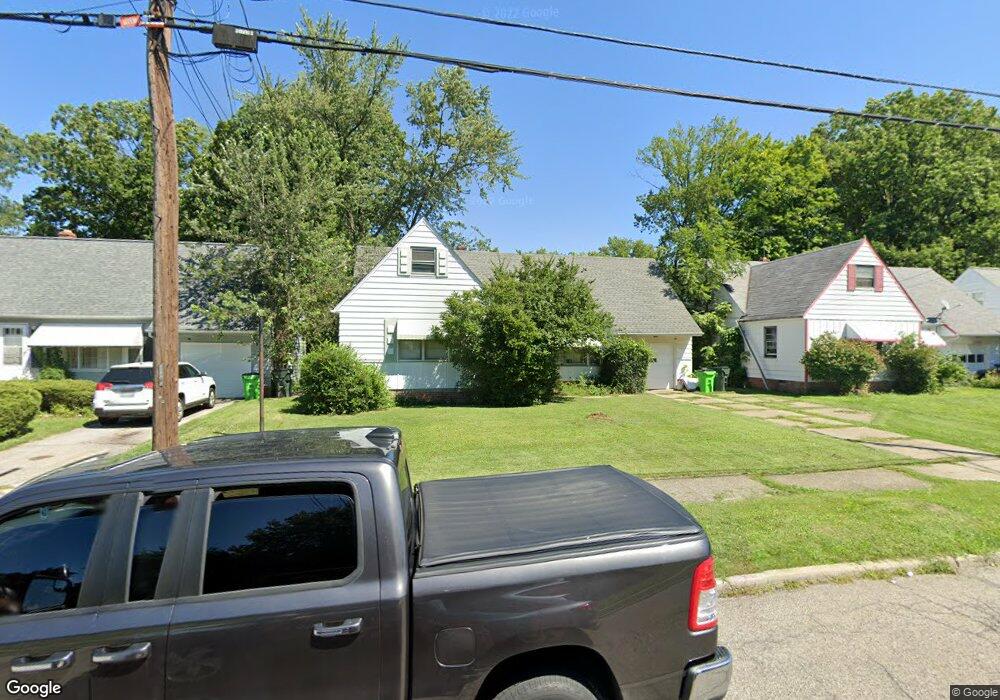
1785 Pontiac Dr Euclid, OH 44117
Estimated Value: $140,000 - $196,000
3
Beds
1
Bath
1,104
Sq Ft
$158/Sq Ft
Est. Value
About This Home
This home is located at 1785 Pontiac Dr, Euclid, OH 44117 and is currently estimated at $174,521, approximately $158 per square foot. 1785 Pontiac Dr is a home located in Cuyahoga County with nearby schools including Bluestone Elementary School, Euclid Middle School, and Euclid High School.
Ownership History
Date
Name
Owned For
Owner Type
Purchase Details
Closed on
Feb 21, 2023
Sold by
Casper Enterprise Group Inc and Muzzyu Ninette S
Bought by
Ciorra Jeffrey Neal
Current Estimated Value
Home Financials for this Owner
Home Financials are based on the most recent Mortgage that was taken out on this home.
Original Mortgage
$171,830
Interest Rate
6.25%
Mortgage Type
FHA
Purchase Details
Closed on
Oct 3, 2022
Sold by
Baker Nina K
Bought by
Casper Enterprise Group Inc
Purchase Details
Closed on
Sep 14, 1990
Sold by
Boka Stephen M
Bought by
Baker Nina K
Purchase Details
Closed on
Feb 17, 1981
Sold by
Boka Stephen M and Boka Geraldine M
Bought by
Boka Stephen M
Purchase Details
Closed on
Jan 1, 1975
Bought by
Boka Stephen M and Boka Geraldine M
Create a Home Valuation Report for This Property
The Home Valuation Report is an in-depth analysis detailing your home's value as well as a comparison with similar homes in the area
Home Values in the Area
Average Home Value in this Area
Purchase History
| Date | Buyer | Sale Price | Title Company |
|---|---|---|---|
| Ciorra Jeffrey Neal | $175,000 | Fast Tract Title | |
| Casper Enterprise Group Inc | $49,000 | Mount Morris Title | |
| Baker Nina K | $60,000 | -- | |
| Boka Stephen M | -- | -- | |
| Boka Stephen M | -- | -- |
Source: Public Records
Mortgage History
| Date | Status | Borrower | Loan Amount |
|---|---|---|---|
| Previous Owner | Ciorra Jeffrey Neal | $171,830 |
Source: Public Records
Tax History Compared to Growth
Tax History
| Year | Tax Paid | Tax Assessment Tax Assessment Total Assessment is a certain percentage of the fair market value that is determined by local assessors to be the total taxable value of land and additions on the property. | Land | Improvement |
|---|---|---|---|---|
| 2024 | $2,135 | $29,855 | $9,765 | $20,090 |
| 2023 | $1,670 | $18,280 | $8,580 | $9,700 |
| 2022 | $1,606 | $18,270 | $8,575 | $9,695 |
| 2021 | $1,782 | $18,270 | $8,580 | $9,700 |
| 2020 | $1,716 | $15,750 | $7,390 | $8,370 |
| 2019 | $2,856 | $87,800 | $21,100 | $66,700 |
| 2018 | $2,883 | $30,730 | $7,390 | $23,350 |
| 2017 | $2,990 | $26,610 | $5,360 | $21,250 |
| 2016 | $2,996 | $26,610 | $5,360 | $21,250 |
| 2015 | $2,726 | $26,610 | $5,360 | $21,250 |
| 2014 | $2,726 | $26,610 | $5,360 | $21,250 |
Source: Public Records
Map
Nearby Homes
- 1809 Pontiac Dr
- 1780 Sagamore Dr
- 1721 Grand Blvd
- 20130 Green Oak Dr
- 19151 Genesee Rd
- 1860 Glenridge Rd
- 24 Washington Square
- 1477 E 195th St
- 1561 E 204th St
- 1556 Dille Rd
- 18132 Weston Rd
- 2110 Miami Rd
- 1707 Catalpa Rd
- 237 Greenbriar Ct Unit F237
- 1563 Clermont Rd
- 1767 Avalon Rd
- 22151 Hadden Rd
- 2010 E 221st St
- 2545 Hilltop Rd
- 2084 E 224th St
- 1779 Pontiac Dr
- 1789 Pontiac Dr
- 1775 Pontiac Dr
- 1795 Pontiac Dr
- 1820 Buena Vista Dr
- 1814 Buena Vista Dr
- 1800 Buena Vista Dr
- 1830 Buena Vista Dr
- 1778 Pontiac Dr
- 1799 Pontiac Dr
- 1769 Pontiac Dr
- 1784 Pontiac Dr
- 1788 Pontiac Dr
- 1784 Buena Vista Dr
- 1776 Pontiac Dr
- 1790 Pinehurst Dr
- 1850 Buena Vista Dr
- 1805 Pontiac Dr
- 1765 Pontiac Dr
- 1792 Pinehurst Dr