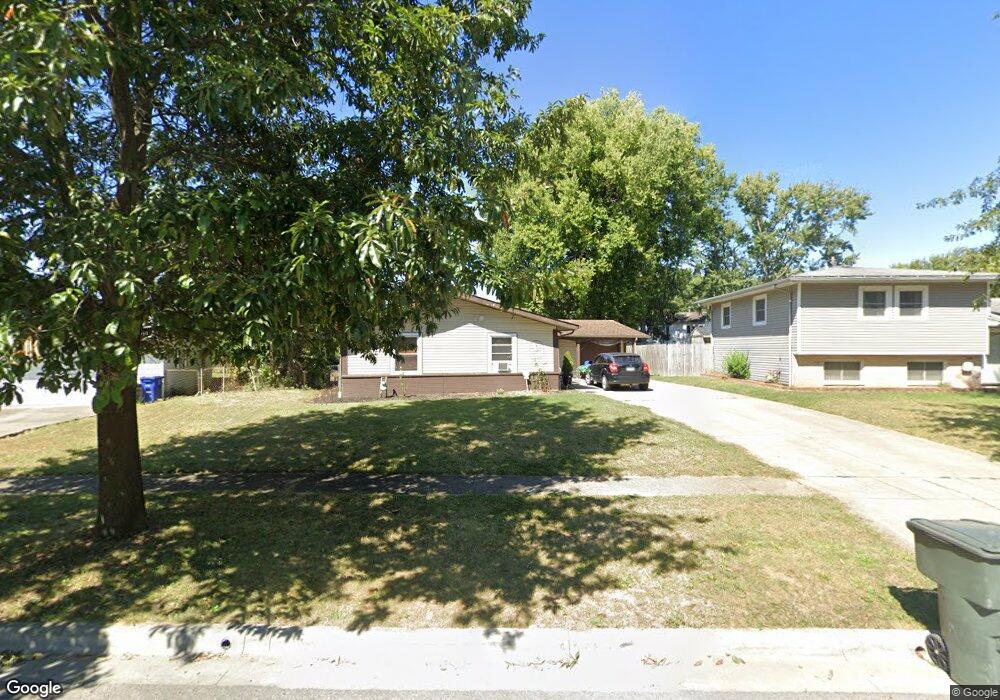
1785 Simpson Dr Columbus, OH 43227
Leawood NeighborhoodEstimated Value: $197,087 - $240,000
4
Beds
2
Baths
1,553
Sq Ft
$141/Sq Ft
Est. Value
About This Home
This home is located at 1785 Simpson Dr, Columbus, OH 43227 and is currently estimated at $219,272, approximately $141 per square foot. 1785 Simpson Dr is a home located in Franklin County with nearby schools including Leawood Elementary School, Sherwood Middle School, and Walnut Ridge High School.
Ownership History
Date
Name
Owned For
Owner Type
Purchase Details
Closed on
Jan 8, 2009
Sold by
Secretary Of Housing & Urban Development
Bought by
Newton Patricia
Current Estimated Value
Home Financials for this Owner
Home Financials are based on the most recent Mortgage that was taken out on this home.
Original Mortgage
$50,501
Outstanding Balance
$31,957
Interest Rate
5.53%
Mortgage Type
FHA
Estimated Equity
$187,315
Purchase Details
Closed on
Feb 21, 2008
Sold by
Anderson Glenda J and National City Mortgage Co
Bought by
Hud
Purchase Details
Closed on
Jun 23, 1999
Sold by
Marzluf Deborah Sue and Marzluf David G
Bought by
Anderson Glenda J
Home Financials for this Owner
Home Financials are based on the most recent Mortgage that was taken out on this home.
Original Mortgage
$81,958
Interest Rate
7.15%
Mortgage Type
FHA
Purchase Details
Closed on
Jul 20, 1998
Sold by
Ramey Jo Wanda
Bought by
Marzluf Deborah Sue
Create a Home Valuation Report for This Property
The Home Valuation Report is an in-depth analysis detailing your home's value as well as a comparison with similar homes in the area
Home Values in the Area
Average Home Value in this Area
Purchase History
| Date | Buyer | Sale Price | Title Company |
|---|---|---|---|
| Newton Patricia | $40,000 | Lakeside Title & Escrow Agen | |
| Hud | $64,000 | None Available | |
| Anderson Glenda J | $82,000 | -- | |
| Marzluf Deborah Sue | -- | -- |
Source: Public Records
Mortgage History
| Date | Status | Borrower | Loan Amount |
|---|---|---|---|
| Open | Newton Patricia | $50,501 | |
| Previous Owner | Anderson Glenda J | $81,958 |
Source: Public Records
Tax History Compared to Growth
Tax History
| Year | Tax Paid | Tax Assessment Tax Assessment Total Assessment is a certain percentage of the fair market value that is determined by local assessors to be the total taxable value of land and additions on the property. | Land | Improvement |
|---|---|---|---|---|
| 2025 | $2,550 | $56,810 | $15,610 | $41,200 |
| 2024 | $2,550 | $56,810 | $15,610 | $41,200 |
| 2023 | $2,517 | $56,805 | $15,610 | $41,195 |
| 2022 | $1,625 | $31,330 | $6,690 | $24,640 |
| 2021 | $1,628 | $31,330 | $6,690 | $24,640 |
| 2020 | $1,630 | $31,330 | $6,690 | $24,640 |
| 2019 | $1,495 | $24,650 | $5,360 | $19,290 |
| 2018 | $1,380 | $24,650 | $5,360 | $19,290 |
| 2017 | $1,494 | $24,650 | $5,360 | $19,290 |
| 2016 | $1,396 | $21,070 | $5,250 | $15,820 |
| 2015 | $1,267 | $21,070 | $5,250 | $15,820 |
| 2014 | $1,270 | $21,070 | $5,250 | $15,820 |
| 2013 | $738 | $24,815 | $6,195 | $18,620 |
Source: Public Records
Map
Nearby Homes
- 4475 Ellery Dr
- 1752 S Hamilton Rd
- 1691 Shady Lane Rd
- 1607 Baxter Dr
- 1618 S Hamilton Rd
- 1607 Simpson Dr
- 4649 Dundee Ave
- 1612 Simpson Dr
- 1571 Baxter Dr
- 1559 Pyle Place
- 1646 Clyde Place
- 1559 Grattan Rd
- 4677 E Livingston Ave
- 4467 Grimsby Rd
- 4484 Grimsby Rd
- 4084 Larry Place Unit 86
- 1377 Marble Dr
- 1356 Harlow Rd
- 1490 Elaine Rd Unit 1462
- 1666-1668 Carstare Dr
- 1777 Simpson Dr
- 1793 Simpson Dr
- 4460 Ellery Dr
- 4453 Drifton Dr
- 1769 Simpson Dr
- 4459 Drifton Dr
- 4452 Ellery Dr
- 4447 Drifton Dr
- 4467 Drifton Dr
- 1761 Simpson Dr
- 4444 Ellery Dr
- 4490 Ellery Dr
- 1784 Simpson Dr
- 1776 Simpson Dr
- 4479 Drifton Dr
- 4459 Ellery Dr
- 4441 Drifton Dr
- 4467 Ellery Dr
- 4451 Ellery Dr
- 4436 Ellery Dr