1785 Slide View Way Washoe Valley, NV 89704
New Washoe City NeighborhoodEstimated Value: $585,805 - $720,000
3
Beds
2
Baths
1,786
Sq Ft
$364/Sq Ft
Est. Value
About This Home
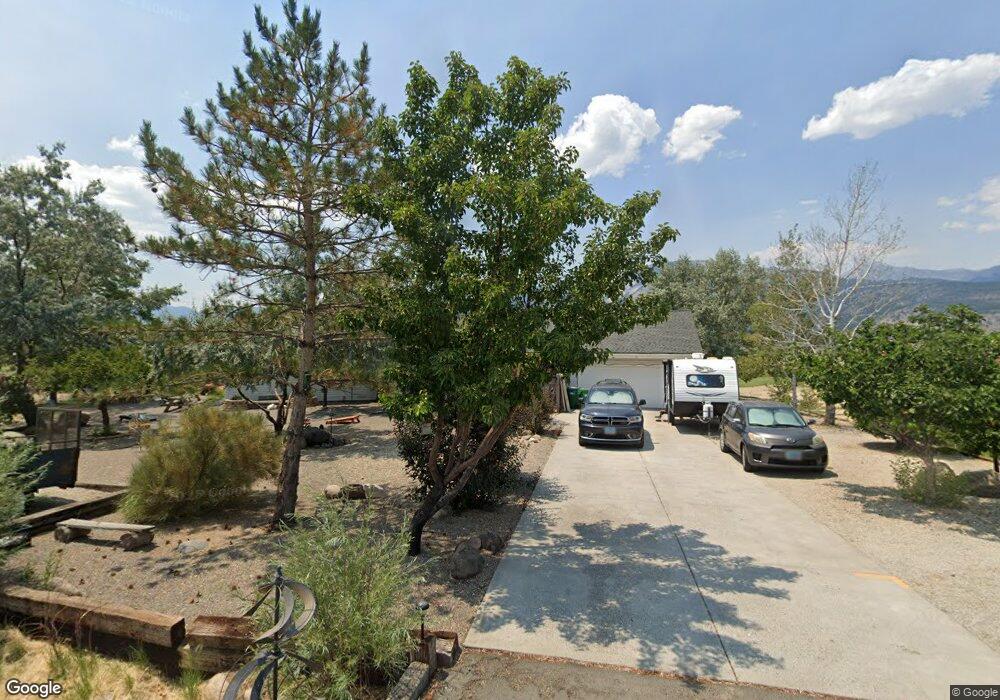
This home is located at 1785 Slide View Way, Washoe Valley, NV 89704 and is currently estimated at $650,451, approximately $364 per square foot. 1785 Slide View Way is a home located in Washoe County with nearby schools including Pleasant Valley Elementary School, Marce Herz Middle School, and Galena High School.
Ownership History
Date
Name
Owned For
Owner Type
Purchase Details
Closed on
May 1, 2015
Sold by
James Brett Charles and James Nancy J
Bought by
James Brett Charles and James Livi J L
Current Estimated Value
Purchase Details
Closed on
Oct 23, 2010
Sold by
James Brett C and James Nancy J
Bought by
James Brett C and James Nancy J
Home Financials for this Owner
Home Financials are based on the most recent Mortgage that was taken out on this home.
Original Mortgage
$139,200
Outstanding Balance
$1,049
Interest Rate
4.33%
Mortgage Type
New Conventional
Estimated Equity
$649,402
Purchase Details
Closed on
Aug 1, 2003
Sold by
Hon Raymond L and Hon Patricia B
Bought by
James Brett C and Waihee Nancy J
Home Financials for this Owner
Home Financials are based on the most recent Mortgage that was taken out on this home.
Original Mortgage
$185,000
Interest Rate
5.17%
Mortgage Type
Unknown
Create a Home Valuation Report for This Property
The Home Valuation Report is an in-depth analysis detailing your home's value as well as a comparison with similar homes in the area
Home Values in the Area
Average Home Value in this Area
Purchase History
| Date | Buyer | Sale Price | Title Company |
|---|---|---|---|
| James Brett Charles | -- | None Available | |
| James Brett C | -- | Northern Nevada Title Cc | |
| James Brett C | $235,000 | Northern Nevada Title Co |
Source: Public Records
Mortgage History
| Date | Status | Borrower | Loan Amount |
|---|---|---|---|
| Open | James Brett C | $139,200 | |
| Closed | James Brett C | $185,000 |
Source: Public Records
Tax History Compared to Growth
Tax History
| Year | Tax Paid | Tax Assessment Tax Assessment Total Assessment is a certain percentage of the fair market value that is determined by local assessors to be the total taxable value of land and additions on the property. | Land | Improvement |
|---|---|---|---|---|
| 2025 | $2,028 | $90,948 | $52,500 | $38,448 |
| 2024 | $1,969 | $86,918 | $47,250 | $39,668 |
| 2023 | $1,969 | $80,212 | $42,000 | $38,212 |
| 2022 | $1,912 | $67,412 | $35,000 | $32,412 |
| 2021 | $1,856 | $59,047 | $26,250 | $32,797 |
| 2020 | $1,802 | $58,861 | $25,550 | $33,311 |
| 2019 | $1,749 | $57,250 | $24,500 | $32,750 |
| 2018 | $1,698 | $57,040 | $24,500 | $32,540 |
| 2017 | $1,649 | $57,192 | $24,150 | $33,042 |
| 2016 | $1,607 | $55,038 | $21,000 | $34,038 |
| 2015 | $1,604 | $49,972 | $15,750 | $34,222 |
| 2014 | $1,557 | $48,059 | $14,700 | $33,359 |
| 2013 | -- | $47,919 | $14,700 | $33,219 |
Source: Public Records
Map
Nearby Homes
- 1740 Slide View Cir
- 55 Darilyn Ln
- 1555 Eastlake Blvd
- 2475 Brenda Way
- 2075 Buckskin Dr
- 2450 Chukar Dr
- 1211 Skinner Dr
- 3460 Pershing Ln
- 1140 Eastlake Blvd
- 3612 White Pine Dr
- 330 Sanctuary Way
- 390 Old Washoe Cir
- 390 Flicker Cir
- 325 Old Washoe Cir
- 300 Old Washoe Cir
- 1015 U S 395
- 395 US Highway 395 S
- APN 05017035
- 04608053 S Us Highway 395
- 3050 US Highway 395
- 200 W Guffey Dr
- 1745 Slide View Way
- 180 W Guffey Dr
- 1850 Slide View Way
- 175 W Guffey Dr
- 1704 Slide View Cir
- 155 W Guffey Dr
- 1695 Slide View Way
- 1905 Lake Shore Dr
- 1700 Slide View Cir
- 140 W Guffey Dr
- 1680 Slide View Way
- 1665 Slide View Way
- 135 W Guffey Dr
- 65 Darilyn Ln
- 1694 Slide View Cir
- 1690 Slide View Cir
- 1937 Lake Shore Dr
- 120 W Guffey Dr
- 1650 Slide View Way