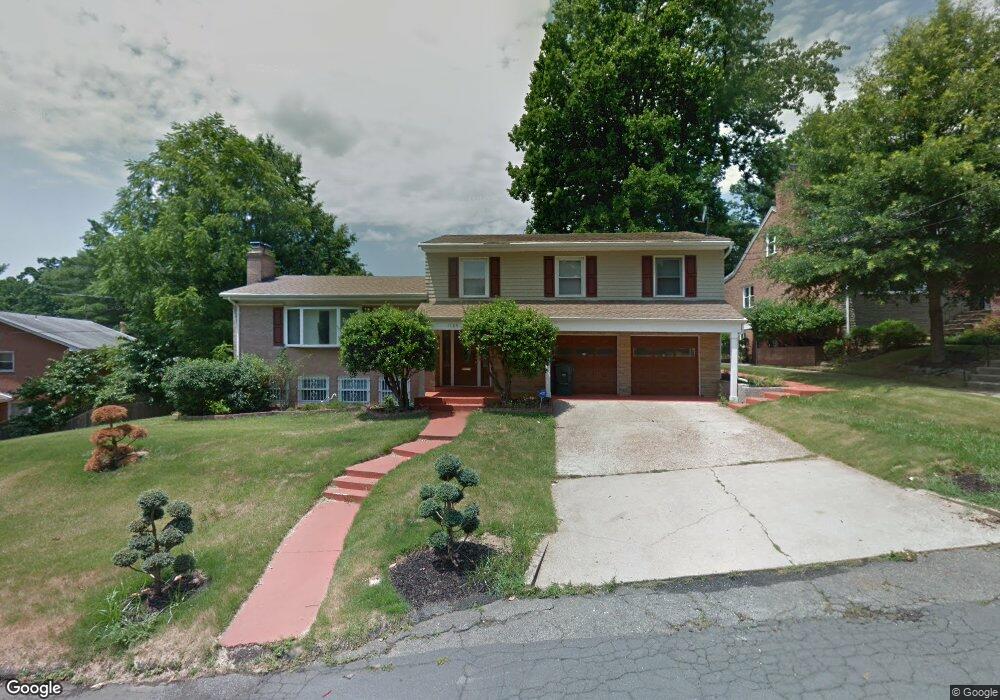
1785 Sycamore St NW Washington, DC 20012
Colonial Village NeighborhoodEstimated Value: $1,001,000 - $1,320,000
3
Beds
3
Baths
1,935
Sq Ft
$591/Sq Ft
Est. Value
About This Home
This home is located at 1785 Sycamore St NW, Washington, DC 20012 and is currently estimated at $1,142,674, approximately $590 per square foot. 1785 Sycamore St NW is a home located in District of Columbia with nearby schools including Shepherd Elementary School, Alice Deal Middle School, and Jackson Reed High School.
Ownership History
Date
Name
Owned For
Owner Type
Purchase Details
Closed on
Jul 1, 2014
Sold by
Blackburn Tiffani J
Bought by
Blackburn Tiffani J and Jones Fritz
Current Estimated Value
Purchase Details
Closed on
Jun 10, 2014
Sold by
Jones Fritz
Bought by
Blackburn Tiffani J
Purchase Details
Closed on
Nov 12, 2008
Sold by
Plus Properties Llc
Bought by
Jones Fritz
Home Financials for this Owner
Home Financials are based on the most recent Mortgage that was taken out on this home.
Original Mortgage
$410,000
Interest Rate
6.47%
Mortgage Type
New Conventional
Purchase Details
Closed on
Mar 14, 2008
Sold by
Cook Irene
Bought by
Plus Properties Llc Profit Sha
Purchase Details
Closed on
Nov 29, 2006
Sold by
Landingham Lillie J Van
Bought by
Paragon Development Llc
Home Financials for this Owner
Home Financials are based on the most recent Mortgage that was taken out on this home.
Original Mortgage
$731,207
Interest Rate
6.16%
Mortgage Type
New Conventional
Create a Home Valuation Report for This Property
The Home Valuation Report is an in-depth analysis detailing your home's value as well as a comparison with similar homes in the area
Home Values in the Area
Average Home Value in this Area
Purchase History
| Date | Buyer | Sale Price | Title Company |
|---|---|---|---|
| Blackburn Tiffani J | -- | -- | |
| Blackburn Tiffani J | -- | -- | |
| Jones Fritz | $485,000 | -- | |
| Plus Properties Llc Profit Sha | $475,000 | -- | |
| Paragon Development Llc | $651,700 | -- |
Source: Public Records
Mortgage History
| Date | Status | Borrower | Loan Amount |
|---|---|---|---|
| Previous Owner | Jones Fritz | $410,000 | |
| Previous Owner | Paragon Development Llc | $731,207 |
Source: Public Records
Tax History Compared to Growth
Tax History
| Year | Tax Paid | Tax Assessment Tax Assessment Total Assessment is a certain percentage of the fair market value that is determined by local assessors to be the total taxable value of land and additions on the property. | Land | Improvement |
|---|---|---|---|---|
| 2024 | $3,001 | $902,440 | $552,420 | $350,020 |
| 2023 | $2,954 | $831,480 | $510,990 | $320,490 |
| 2022 | $2,919 | $765,520 | $493,280 | $272,240 |
| 2021 | $2,790 | $732,900 | $481,000 | $251,900 |
| 2020 | $2,737 | $719,760 | $464,210 | $255,550 |
| 2019 | $2,661 | $701,030 | $447,420 | $253,610 |
| 2018 | $2,626 | $691,120 | $0 | $0 |
| 2017 | $2,537 | $669,380 | $0 | $0 |
| 2016 | $2,318 | $627,820 | $0 | $0 |
| 2015 | $2,108 | $590,770 | $0 | $0 |
| 2014 | $1,922 | $522,400 | $0 | $0 |
Source: Public Records
Map
Nearby Homes
- 1700 Verbena St NW
- 2214 Washington Ave Unit 103
- 2212 Washington Ave Unit 102
- 2210 Washington Ave Unit W103
- 2240 Washington Ave Unit 101A
- 2238 Washington Ave Unit 101
- 1601 N Portal Dr NW
- 2100 Washington Ave
- 7928 16th St NW
- 1776 East-West Hwy Unit 1776
- 7800 Orchid St NW
- 8003 16th St NW
- 2223 Washington Ave Unit 2223-W
- 2223 Washington Ave Unit 204
- 2312 Colston Dr Unit 201
- 1467 Roxanna Rd NW
- 1454 Roxanna Rd NW
- 2318 Blaine Dr
- 2106 Ross Rd
- 7746 16th St NW
- 1781 Sycamore St NW
- 1905 Tulip St NW
- 1789 Sycamore St NW
- 1909 Tulip St NW
- 1777 Sycamore St NW
- 1913 Tulip St NW
- 1780 Sycamore St NW
- 1784 Sycamore St NW
- 1776 Sycamore St NW
- 1770 Sycamore St NW
- 1788 Sycamore St NW
- 1917 Tulip St NW
- 1900 Tulip St NW
- 1904 Tulip St NW
- 1764 Sycamore St NW
- 1908 Tulip St NW
- 1912 Tulip St NW
- 1921 Tulip St NW
- 1809 Redwood Terrace NW
- 1815 Redwood Terrace NW