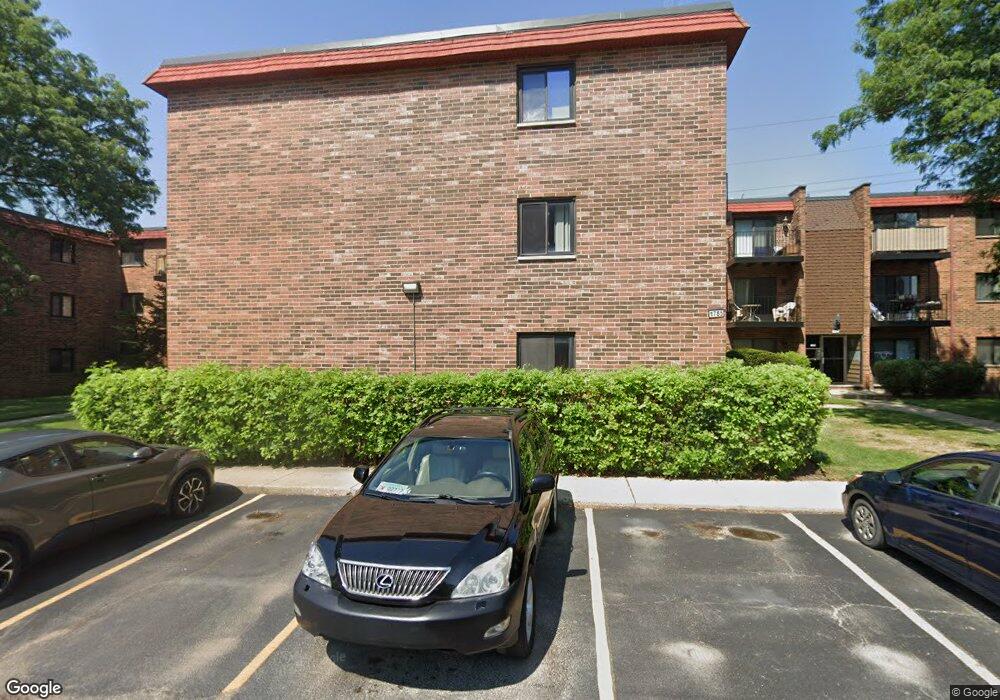
1785 W Algonquin Rd Unit 17851 Mount Prospect, IL 60056
Estimated Value: $161,000 - $243,000
2
Beds
2
Baths
--
Sq Ft
4.72
Acres
About This Home
This home is located at 1785 W Algonquin Rd Unit 17851, Mount Prospect, IL 60056 and is currently estimated at $202,687. 1785 W Algonquin Rd Unit 17851 is a home located in Cook County with nearby schools including Holmes Jr High School, Juliette Low Elementary School, and Rolling Meadows High School.
Ownership History
Date
Name
Owned For
Owner Type
Purchase Details
Closed on
Apr 24, 2009
Sold by
Fannie Mae
Bought by
Zegarski Joanna
Current Estimated Value
Purchase Details
Closed on
Dec 4, 2007
Sold by
Oberstar Cari Lynn
Bought by
Federal National Mortgage Association
Purchase Details
Closed on
Jun 3, 2005
Sold by
Patel Sanjay Kumar V and Patel Vinaben S
Bought by
Oberstar Cari Lynn
Home Financials for this Owner
Home Financials are based on the most recent Mortgage that was taken out on this home.
Original Mortgage
$134,000
Interest Rate
5.75%
Mortgage Type
New Conventional
Purchase Details
Closed on
Jul 14, 1999
Sold by
Wolff Dorothy
Bought by
Patel Sanjaykumar V and Patel Vinaben S
Home Financials for this Owner
Home Financials are based on the most recent Mortgage that was taken out on this home.
Original Mortgage
$70,000
Interest Rate
7.68%
Create a Home Valuation Report for This Property
The Home Valuation Report is an in-depth analysis detailing your home's value as well as a comparison with similar homes in the area
Home Values in the Area
Average Home Value in this Area
Purchase History
| Date | Buyer | Sale Price | Title Company |
|---|---|---|---|
| Zegarski Joanna | -- | Git | |
| Federal National Mortgage Association | -- | None Available | |
| Oberstar Cari Lynn | $167,500 | -- | |
| Patel Sanjaykumar V | $87,950 | -- |
Source: Public Records
Mortgage History
| Date | Status | Borrower | Loan Amount |
|---|---|---|---|
| Previous Owner | Oberstar Cari Lynn | $134,000 | |
| Previous Owner | Patel Sanjaykumar V | $70,000 |
Source: Public Records
Tax History Compared to Growth
Tax History
| Year | Tax Paid | Tax Assessment Tax Assessment Total Assessment is a certain percentage of the fair market value that is determined by local assessors to be the total taxable value of land and additions on the property. | Land | Improvement |
|---|---|---|---|---|
| 2024 | $3,522 | $13,520 | $2,092 | $11,428 |
| 2023 | $3,382 | $13,520 | $2,092 | $11,428 |
| 2022 | $3,382 | $13,520 | $2,092 | $11,428 |
| 2021 | $2,878 | $10,071 | $1,996 | $8,075 |
| 2020 | $2,801 | $10,071 | $1,996 | $8,075 |
| 2019 | $2,869 | $11,352 | $1,996 | $9,356 |
| 2018 | $2,238 | $7,838 | $1,711 | $6,127 |
| 2017 | $2,244 | $7,838 | $1,711 | $6,127 |
| 2016 | $2,110 | $7,838 | $1,711 | $6,127 |
| 2015 | $2,238 | $7,752 | $1,521 | $6,231 |
| 2014 | $2,413 | $8,499 | $1,521 | $6,978 |
| 2013 | $2,357 | $8,499 | $1,521 | $6,978 |
Source: Public Records
Map
Nearby Homes
- 1785 W Algonquin Rd Unit 2A
- 1727 W Crystal Ln Unit 208
- 2829 S Briarwood Dr E
- 1747 W Crystal Ln Unit 308
- 1717 W Crystal Ln Unit 701
- 1717 W Crystal Ln Unit 610
- 1115 E Algonquin Rd Unit 8
- 1119 E Algonquin Rd Unit 2
- 1119 E Algonquin Rd Unit 7
- 1500 S Busse Rd Unit 2D
- 1900 W Knightsbridge Dr Unit 2B
- 1111 E Algonquin Rd Unit 1
- 1107 E Algonquin Rd Unit 4
- 1910 W Hatherleigh Ct Unit 2A
- 1915 Whitechapel Dr Unit 1E
- 2831 S Embers Ln Unit 352831
- 1429 S Busse Rd
- 2669 S Embers Ln Unit 142669
- 1813 W Pheasant Trail
- 728 Dempster St Unit 210
- 1789 W Algonquin Rd Unit 17892
- 1789 W Algonquin Rd Unit 17891
- 1783 W Algonquin Rd Unit 17833
- 1781 W Algonquin Rd Unit 17811
- 1789 W Algonquin Rd Unit 17893
- 1787 W Algonquin Rd Unit 17873
- 1785 W Algonquin Rd Unit 17852
- 1785 W Algonquin Rd Unit 17851
- 1787 W Algonquin Rd Unit 17873
- 1781 W Algonquin Rd Unit 17813
- 1783 W Algonquin Rd Unit 17832
- 1781 W Algonquin Rd Unit 17812
- 1789 W Algonquin Rd Unit 17891
- 1785 W Algonquin Rd Unit 17853
- 1787 W Algonquin Rd Unit 17871
- 1783 W Algonquin Rd Unit 17833
- 1783 W Algonquin Rd Unit 17831
- 1783 W Algonquin Rd Unit 17831
- 1789 W Algonquin Rd Unit 17893
- 1787 W Algonquin Rd Unit 17872