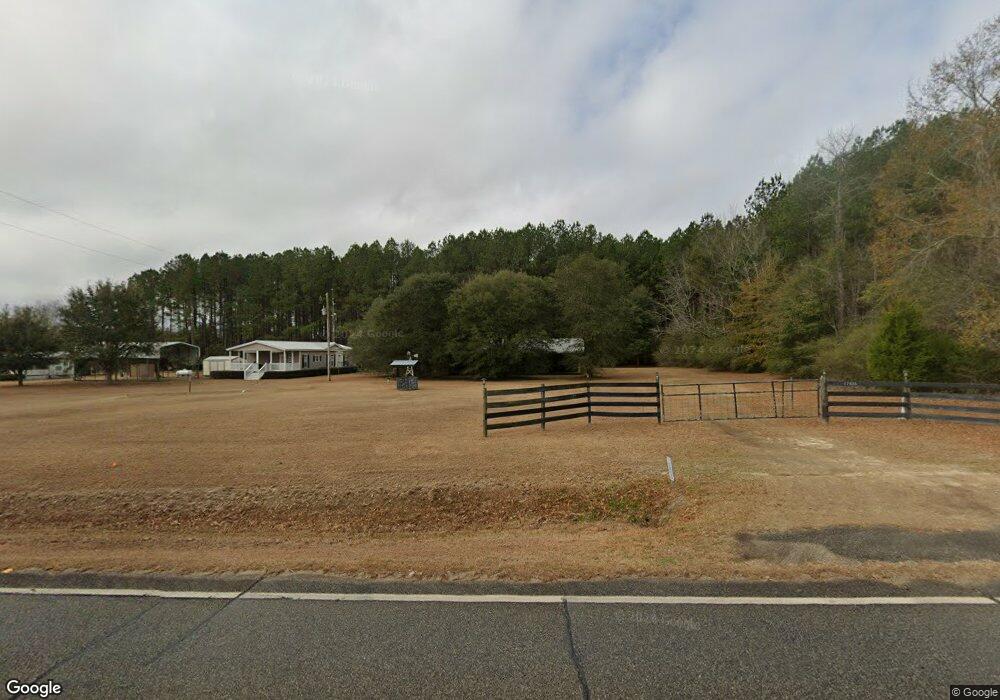
17855 Ga Highway 39 Blakely, GA 39823
Estimated Value: $197,727 - $345,000
1
Bed
1
Bath
640
Sq Ft
$377/Sq Ft
Est. Value
About This Home
This home is located at 17855 Ga Highway 39, Blakely, GA 39823 and is currently estimated at $241,182, approximately $376 per square foot. 17855 Ga Highway 39 is a home with nearby schools including Early County Elementary School, Early County Middle School, and Early County High School.
Ownership History
Date
Name
Owned For
Owner Type
Purchase Details
Closed on
Mar 25, 2025
Sold by
Widener Bell Diane
Bought by
Evans Deana Howard and Evans Philip Anthony
Current Estimated Value
Purchase Details
Closed on
Aug 13, 2010
Sold by
Wilson John C
Bought by
Wilson John Charles and Wilson Linda Ann
Purchase Details
Closed on
Mar 26, 2008
Sold by
Farmer William O
Bought by
Farmer William O and Farmer Linda L
Purchase Details
Closed on
Nov 9, 2006
Sold by
Harrell Henry Lynn
Bought by
Wilson John C and Farmer William Okla
Purchase Details
Closed on
Apr 6, 2006
Sold by
Weeks Edna P
Bought by
Harrell Henry Lynn and Harrell Pamela L
Purchase Details
Closed on
Jun 4, 2002
Sold by
Holt Alice Hazel
Bought by
Weeks Collis R
Purchase Details
Closed on
Oct 20, 2000
Sold by
Weeks Collis R
Bought by
Holt Alice Hazel
Purchase Details
Closed on
Jan 25, 1994
Bought by
Weeks Collis R
Create a Home Valuation Report for This Property
The Home Valuation Report is an in-depth analysis detailing your home's value as well as a comparison with similar homes in the area
Home Values in the Area
Average Home Value in this Area
Purchase History
| Date | Buyer | Sale Price | Title Company |
|---|---|---|---|
| Evans Deana Howard | $210,000 | -- | |
| Wilson John Charles | -- | -- | |
| Dye Ronald Norman | -- | -- | |
| Farmer William Okla | -- | -- | |
| Farmer William O | -- | -- | |
| Wilson John C | $36,000 | -- | |
| Harrell Henry Lynn | $20,000 | -- | |
| Weeks Collis R | -- | -- | |
| Holt Alice Hazel | $5,000 | -- | |
| Weeks Collis R | $2,400 | -- |
Source: Public Records
Tax History Compared to Growth
Tax History
| Year | Tax Paid | Tax Assessment Tax Assessment Total Assessment is a certain percentage of the fair market value that is determined by local assessors to be the total taxable value of land and additions on the property. | Land | Improvement |
|---|---|---|---|---|
| 2024 | $950 | $35,259 | $6,156 | $29,103 |
| 2023 | $951 | $35,259 | $6,156 | $29,103 |
| 2022 | $792 | $31,410 | $4,479 | $26,931 |
| 2021 | $872 | $34,249 | $4,479 | $29,770 |
| 2020 | $856 | $34,249 | $4,479 | $29,770 |
| 2019 | $708 | $27,541 | $4,479 | $23,062 |
| 2018 | $636 | $24,721 | $4,479 | $20,242 |
| 2017 | $636 | $24,699 | $4,479 | $20,220 |
| 2016 | $618 | $23,187 | $4,479 | $18,708 |
| 2015 | -- | $23,134 | $3,789 | $19,345 |
| 2014 | -- | $23,134 | $3,789 | $19,345 |
| 2013 | -- | $23,327 | $3,789 | $19,538 |
Source: Public Records
Map
Nearby Homes
- 216 Willow Glen Dr
- 203 Willow Glen Dr
- 21141 Lucile Rd
- 934 Southside Dr
- 7507 Old Lucile Rd
- 108 Peterson Ln
- 18802 E South Blvd
- 74 S Lancelot St
- 93 Arnall Blvd
- 600 Chattahoochee Ave
- 00 Garden Dr
- 556 Flowers Dr
- 8 Lots Unknown Ln
- 11401 Columbia St
- 73 W Westward Ave
- 76 S Jefferson Ave
- 73 Grove Place
- 234 College St
- 337 College St
- 000 Georgia 62
- 17849 Ga Highway 39
- 17845 Ga Highway 39
- 17794 Ga Highway 39
- 17736 Ga Highway 39
- 1290 Rock Bluff Rd
- 948 Rock Bluff Rd
- 17613 Ga Highway 39
- 18187 Ga Highway 39
- 18220 Ga Highway 39
- 18221 Ga Highway 39
- 1480 Rock Bluff Rd
- 18267 Ga Highway 39
- 17495 Ga Highway 39
- 18285 Ga Highway 39
- 17341 Ga Highway 39
- 17425 Ga Highway 39
- 17400 Ga Highway 39
- 17363 Ga Highway 39
- 17321 Ga Highway 39
- 17976 Ga Highway 39