Estimated Value: $234,650 - $267,000
2
Beds
1
Bath
990
Sq Ft
$252/Sq Ft
Est. Value
About This Home
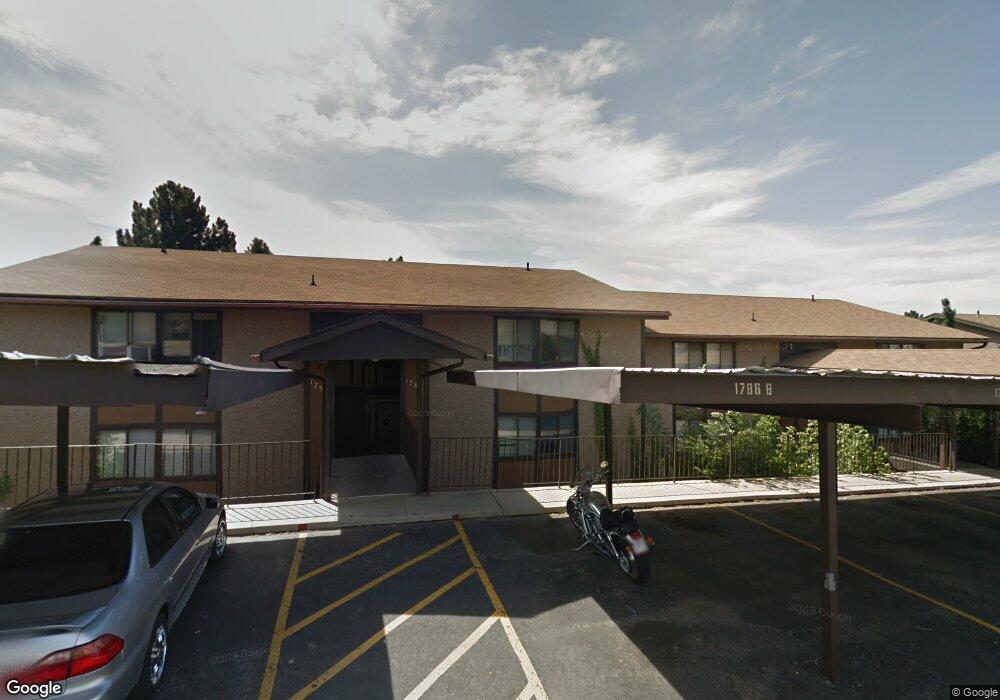
This home is located at 1786 E 5625 S Unit B, Ogden, UT 84403 and is currently estimated at $249,163, approximately $251 per square foot. 1786 E 5625 S Unit B is a home located in Weber County with nearby schools including Uintah School, South Ogden Junior High School, and Bonneville High School.
Ownership History
Date
Name
Owned For
Owner Type
Purchase Details
Closed on
Jul 26, 2023
Sold by
Remkus Samantha
Bought by
Winward Emer Kent
Current Estimated Value
Home Financials for this Owner
Home Financials are based on the most recent Mortgage that was taken out on this home.
Original Mortgage
$196,000
Outstanding Balance
$190,421
Interest Rate
6.67%
Mortgage Type
New Conventional
Estimated Equity
$58,742
Purchase Details
Closed on
Nov 11, 2021
Sold by
Nighswonger Schamber Cinda
Bought by
Remkus Samantha
Home Financials for this Owner
Home Financials are based on the most recent Mortgage that was taken out on this home.
Original Mortgage
$215,650
Interest Rate
3.05%
Mortgage Type
New Conventional
Purchase Details
Closed on
Jul 21, 2017
Sold by
Zbf Investments I Llc
Bought by
Schamber Cinda Nighwswonger
Home Financials for this Owner
Home Financials are based on the most recent Mortgage that was taken out on this home.
Original Mortgage
$102,359
Interest Rate
3.9%
Mortgage Type
New Conventional
Purchase Details
Closed on
Jun 14, 1999
Sold by
Zbf Investments
Bought by
Zbf Investments I Llc
Create a Home Valuation Report for This Property
The Home Valuation Report is an in-depth analysis detailing your home's value as well as a comparison with similar homes in the area
Home Values in the Area
Average Home Value in this Area
Purchase History
| Date | Buyer | Sale Price | Title Company |
|---|---|---|---|
| Winward Emer Kent | -- | Truly Title | |
| Remkus Samantha | -- | Real Advantage Title | |
| Schamber Cinda Nighwswonger | -- | Hickman Land Title Co | |
| Zbf Investments I Llc | -- | Cardon Land Title |
Source: Public Records
Mortgage History
| Date | Status | Borrower | Loan Amount |
|---|---|---|---|
| Open | Winward Emer Kent | $196,000 | |
| Previous Owner | Remkus Samantha | $215,650 | |
| Previous Owner | Schamber Cinda Nighwswonger | $102,359 |
Source: Public Records
Tax History
| Year | Tax Paid | Tax Assessment Tax Assessment Total Assessment is a certain percentage of the fair market value that is determined by local assessors to be the total taxable value of land and additions on the property. | Land | Improvement |
|---|---|---|---|---|
| 2025 | $1,515 | $236,300 | $50,000 | $186,300 |
| 2024 | $1,446 | $126,500 | $27,500 | $99,000 |
| 2023 | $1,298 | $113,300 | $27,500 | $85,800 |
| 2022 | $1,245 | $111,100 | $27,500 | $83,600 |
| 2021 | $937 | $141,000 | $30,000 | $111,000 |
| 2020 | $867 | $122,000 | $18,000 | $104,000 |
| 2019 | $859 | $116,000 | $18,000 | $98,000 |
| 2018 | $826 | $106,000 | $18,000 | $88,000 |
| 2017 | $654 | $81,000 | $15,000 | $66,000 |
| 2016 | $615 | $42,900 | $7,700 | $35,200 |
| 2015 | $525 | $35,750 | $7,700 | $28,050 |
| 2014 | $372 | $24,805 | $7,700 | $17,105 |
Source: Public Records
Map
Nearby Homes
- 1842 E 5625 S Unit C
- 5630 Meadow Ln Unit 172
- 5630 Meadow Ln Unit 192
- 5660 S Meadow Ln Unit 140
- 5600 Meadow Ln Unit 144
- 5600 Meadow Ln Unit 193
- 1805 E 5750 S
- 1929 E 5625 S
- 5780 Village Way
- 5660 S 1425 E Unit E3
- 5973 S South Weber Dr
- 6362 S Ray Dr Unit 109
- 65 W Glen Way Unit 127
- 7870 S 2700 E
- 944 W Columbia Ct Unit 108
- 215 E 40th S
- 938 W Motor Vu Dr Unit 208
- 6374 S Ray Dr Unit 111
- 5341 Fillmore Ave
- 5685 S Village Cir
- 1786 E 5625 S Unit C
- 1786 E 5625 S
- 1786 E 5625 S Unit A
- 1792 E 5625 S Unit B
- 1792 E 5625 S
- 1792 E 5625 S Unit A
- 1780 E 5625 S Unit C
- 1780 E 5625 S Unit B
- 1780 E 5625 S
- 1780 E 5625 S Unit 16
- 1776 E 5625 S Unit C
- 1776 E 5625 S Unit A
- 1776 E 5625 S
- 1776 E 5625 S Unit B
- 1800 E 5625 S Unit C
- 1800 E 5625 S Unit B
- 1800 E 5625 S Unit T25
- 1800 E 5625 S Unit A
- 5625 S 1800 E Unit A
- 1778 E 5625 S Unit B
Your Personal Tour Guide
Ask me questions while you tour the home.