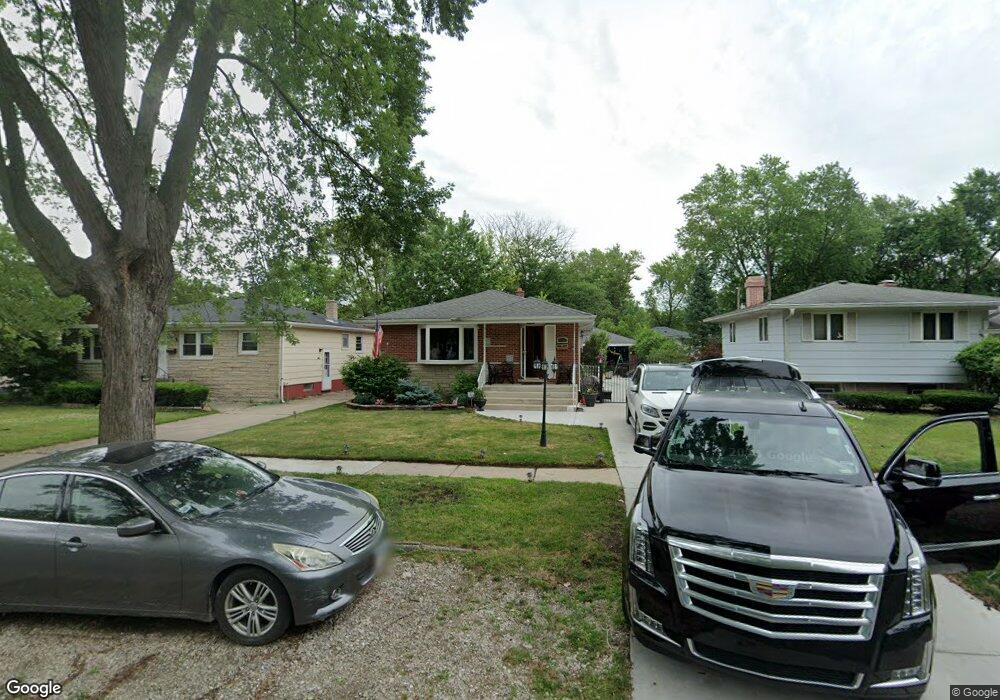
17861 Locust St Lansing, IL 60438
Estimated Value: $196,866 - $279,000
3
Beds
2
Baths
1,269
Sq Ft
$182/Sq Ft
Est. Value
About This Home
This home is located at 17861 Locust St, Lansing, IL 60438 and is currently estimated at $231,467, approximately $182 per square foot. 17861 Locust St is a home located in Cook County with nearby schools including Oak Glen Elementary School, Memorial Jr High School, and Thornton Fractnl So High School.
Ownership History
Date
Name
Owned For
Owner Type
Purchase Details
Closed on
Jul 19, 2021
Sold by
King Renitta
Bought by
King Renitta and King Michael
Current Estimated Value
Home Financials for this Owner
Home Financials are based on the most recent Mortgage that was taken out on this home.
Original Mortgage
$98,600
Outstanding Balance
$73,914
Interest Rate
2.93%
Mortgage Type
New Conventional
Estimated Equity
$157,553
Purchase Details
Closed on
Nov 22, 2010
Sold by
Olson Dawn M and Schaap John R
Bought by
King Renitta
Home Financials for this Owner
Home Financials are based on the most recent Mortgage that was taken out on this home.
Original Mortgage
$132,120
Interest Rate
4.25%
Mortgage Type
FHA
Purchase Details
Closed on
Oct 24, 2009
Sold by
Schaap Anthony
Bought by
Schaap Anthony and Anthony Schaap Trust
Purchase Details
Closed on
Feb 5, 1987
Sold by
Bank Of Lansing Lansing Ill
Bought by
Schaap Anthony and Schaap Alyda
Home Financials for this Owner
Home Financials are based on the most recent Mortgage that was taken out on this home.
Original Mortgage
$90,000
Interest Rate
8.73%
Create a Home Valuation Report for This Property
The Home Valuation Report is an in-depth analysis detailing your home's value as well as a comparison with similar homes in the area
Home Values in the Area
Average Home Value in this Area
Purchase History
| Date | Buyer | Sale Price | Title Company |
|---|---|---|---|
| King Renitta | -- | Mortgage Connect Lp | |
| King Renitta | $134,000 | Pntn | |
| Schaap Anthony | -- | None Available | |
| Schaap Anthony | -- | -- | |
| Schaap Anthony | -- | -- |
Source: Public Records
Mortgage History
| Date | Status | Borrower | Loan Amount |
|---|---|---|---|
| Open | King Renitta | $98,600 | |
| Closed | King Renitta | $132,120 | |
| Previous Owner | Schaap Anthony | $90,000 |
Source: Public Records
Tax History
| Year | Tax Paid | Tax Assessment Tax Assessment Total Assessment is a certain percentage of the fair market value that is determined by local assessors to be the total taxable value of land and additions on the property. | Land | Improvement |
|---|---|---|---|---|
| 2025 | $5,266 | $14,200 | $3,124 | $11,076 |
| 2024 | $5,266 | $14,200 | $3,124 | $11,076 |
| 2023 | $4,516 | $14,200 | $3,124 | $11,076 |
| 2022 | $4,516 | $10,369 | $2,756 | $7,613 |
| 2021 | $4,450 | $10,369 | $2,756 | $7,613 |
| 2020 | $4,263 | $10,369 | $2,756 | $7,613 |
| 2019 | $4,619 | $11,542 | $2,572 | $8,970 |
| 2018 | $4,530 | $11,542 | $2,572 | $8,970 |
| 2017 | $4,608 | $11,542 | $2,572 | $8,970 |
| 2016 | $4,224 | $10,222 | $2,388 | $7,834 |
| 2015 | $3,861 | $10,222 | $2,388 | $7,834 |
| 2014 | $3,835 | $10,222 | $2,388 | $7,834 |
| 2013 | $3,062 | $9,431 | $2,388 | $7,043 |
Source: Public Records
Map
Nearby Homes
- 17871 Locust St
- 17902 Locust St
- 17934 Locust St
- 2201 Thornton Lansing Rd
- 17832 Glen Oak Ave
- 17001 Glen Oak Ave
- 2306 Holiday Terrace Unit 144
- 2306 Holiday Terrace Unit 163
- 2306 Holiday Terrace Unit 146
- 2237 175th St Unit 2B
- 2304 Holiday Terrace Unit 505
- 18005 Arcadia Ave
- 17750 Clyde Ave
- 1844 180th Place
- 17825 Oakley Ave
- 1943 182nd St
- 18309 Bock Rd
- 18118 Whitman Ln
- 18035 Oakley Ave
- 17803 Escanaba Ave
- 17855 Locust St
- 17837 Locust St
- 17881 Locust St
- 17831 Locust St
- 17850 Rose St
- 17854 Rose St
- 17925 Locust St
- 17838 Rose St
- 17858 Rose St
- 17825 Locust St
- 17927 Locust St
- 17832 Rose St
- 17862 Rose St
- 17842 Locust St
- 17850 Locust St
- 17834 Locust St
- 17819 Locust St
- 17826 Rose St
- 17929 Locust St
- 17858 Locust St
Your Personal Tour Guide
Ask me questions while you tour the home.