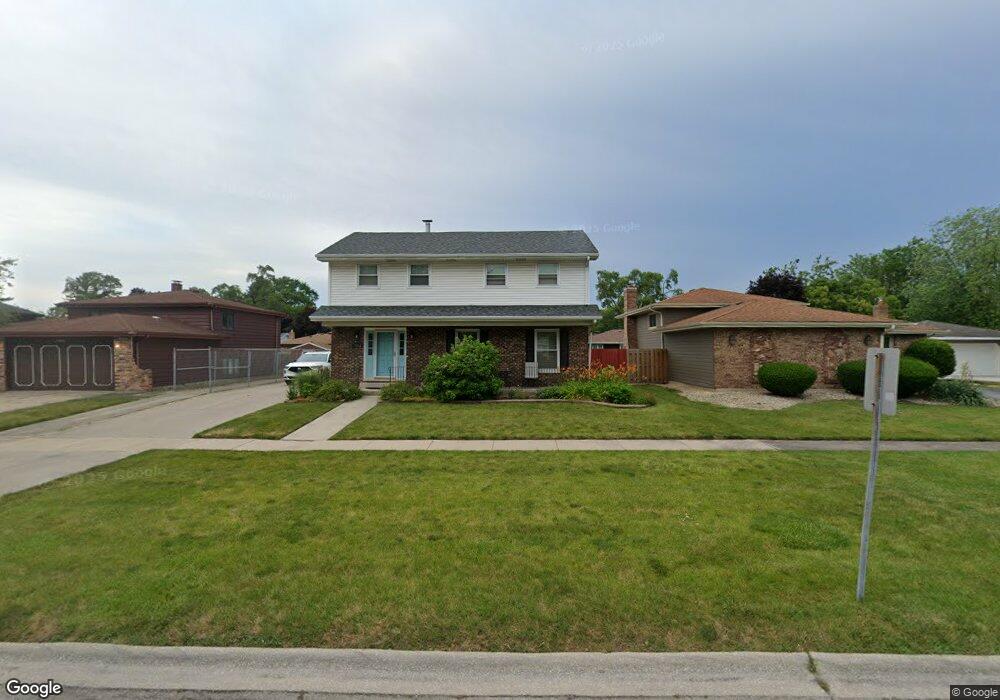
17862 State Line Rd Lansing, IL 60438
Estimated Value: $272,120 - $373,000
4
Beds
3
Baths
1,400
Sq Ft
$225/Sq Ft
Est. Value
About This Home
This home is located at 17862 State Line Rd, Lansing, IL 60438 and is currently estimated at $314,780, approximately $224 per square foot. 17862 State Line Rd is a home located in Cook County with nearby schools including Coolidge Elementary School, Memorial Jr High School, and Thornton Fractnl So High School.
Ownership History
Date
Name
Owned For
Owner Type
Purchase Details
Closed on
Apr 2, 2024
Sold by
Thompson Debrina
Bought by
Chicago Title Land Trust
Current Estimated Value
Purchase Details
Closed on
Sep 25, 2020
Sold by
Kooyenga Chad O and Kooyenga Jennifer J
Bought by
Thompson Debrina
Home Financials for this Owner
Home Financials are based on the most recent Mortgage that was taken out on this home.
Original Mortgage
$256,500
Interest Rate
2.99%
Mortgage Type
New Conventional
Purchase Details
Closed on
Jul 2, 2004
Sold by
Calleros Pierre E
Bought by
Kooyenga Chad O and Kooyenga Jennifer J
Home Financials for this Owner
Home Financials are based on the most recent Mortgage that was taken out on this home.
Original Mortgage
$196,000
Interest Rate
6.42%
Mortgage Type
Unknown
Create a Home Valuation Report for This Property
The Home Valuation Report is an in-depth analysis detailing your home's value as well as a comparison with similar homes in the area
Home Values in the Area
Average Home Value in this Area
Purchase History
| Date | Buyer | Sale Price | Title Company |
|---|---|---|---|
| Chicago Title Land Trust | -- | None Listed On Document | |
| Thompson Debrina | $270,000 | Old Republic Title | |
| Kooyenga Chad O | $196,000 | Stewart Title Guaranty Compa |
Source: Public Records
Mortgage History
| Date | Status | Borrower | Loan Amount |
|---|---|---|---|
| Previous Owner | Thompson Debrina | $256,500 | |
| Previous Owner | Kooyenga Chad O | $196,000 |
Source: Public Records
Tax History Compared to Growth
Tax History
| Year | Tax Paid | Tax Assessment Tax Assessment Total Assessment is a certain percentage of the fair market value that is determined by local assessors to be the total taxable value of land and additions on the property. | Land | Improvement |
|---|---|---|---|---|
| 2024 | $10,975 | $23,233 | $4,228 | $19,005 |
| 2023 | $8,436 | $26,000 | $4,228 | $21,772 |
| 2022 | $8,436 | $16,401 | $3,652 | $12,749 |
| 2021 | $8,262 | $16,400 | $3,651 | $12,749 |
| 2020 | $7,802 | $16,400 | $3,651 | $12,749 |
| 2019 | $7,590 | $16,761 | $3,075 | $13,686 |
| 2018 | $7,446 | $16,761 | $3,075 | $13,686 |
| 2017 | $7,552 | $16,761 | $3,075 | $13,686 |
| 2016 | $6,496 | $14,377 | $2,883 | $11,494 |
| 2015 | $6,520 | $15,456 | $2,883 | $12,573 |
| 2014 | $6,457 | $15,456 | $2,883 | $12,573 |
| 2013 | $6,317 | $16,659 | $2,883 | $13,776 |
Source: Public Records
Map
Nearby Homes
- 17922 State Line Ave
- 17945 Maple St
- 108 Beverly Place
- 7937 Forest Ave
- 8019 Hohman Ave
- 17706 Wentworth Ave
- 7624 Forest Ave
- 17702 Bernadine St
- 3423 Adams St
- 8130 Meadow Ln
- 248 Adelaide Place
- 17611 Bernadine St
- 17517 Shirley Dr
- 3627 Ridge Rd
- 7905 Frederick Ave
- 237 Hollywood Ave
- 18215 Wentworth Ave Unit 3B
- 17511 Maple Ave
- 3336 178th St
- 18333 Wentworth Ave Unit 7
- 17862 State Line Ave
- 17856 State Line Ave
- 17904 State Line Ave
- 17850 State Line Ave
- 17910 State Line Ave
- 17861 Maple St
- 17855 Maple St
- 17903 Maple St
- 17844 State Line Ave
- 17849 Maple St
- 17909 Maple St
- 17916 State Line Ave
- 8 Beverly Place
- 7 Beverly Place
- 17843 Maple St
- 17838 State Line Ave
- 17915 Maple St
- 17837 Maple St
- 14 Beverly Place
- 11 Beverly Place