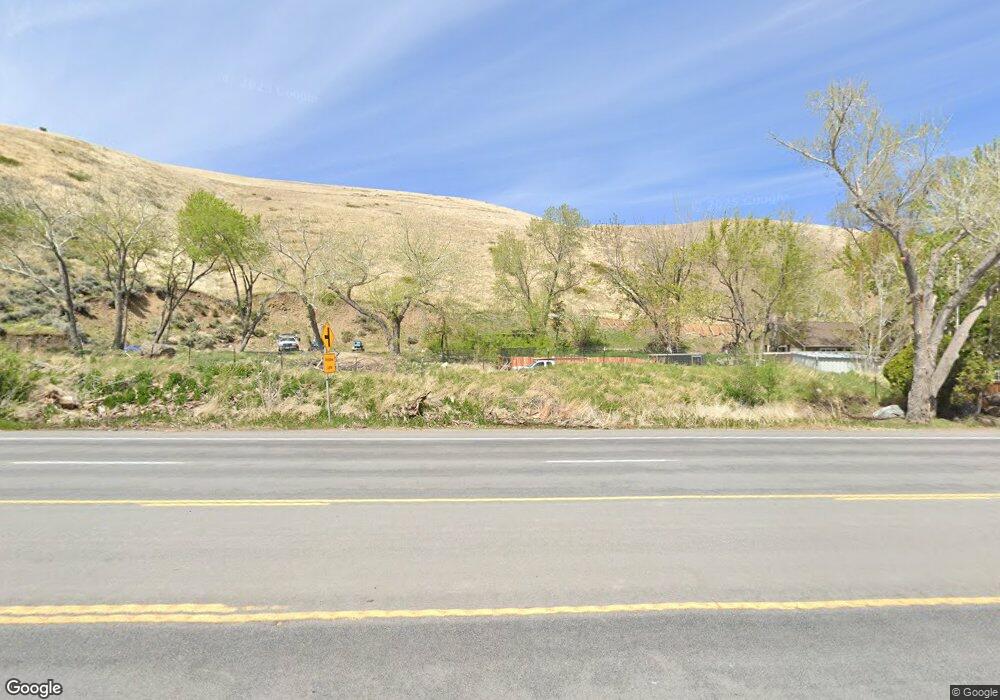
17865 S Virginia St Reno, NV 89521
Hidden Lake NeighborhoodEstimated Value: $156,000 - $783,000
6
Beds
3
Baths
3,163
Sq Ft
$181/Sq Ft
Est. Value
About This Home
This home is located at 17865 S Virginia St, Reno, NV 89521 and is currently estimated at $573,000, approximately $181 per square foot. 17865 S Virginia St is a home located in Washoe County with nearby schools including Pleasant Valley Elementary School, Marce Herz Middle School, and Galena High School.
Ownership History
Date
Name
Owned For
Owner Type
Purchase Details
Closed on
May 16, 2024
Sold by
Petrilla Marcus A and Petrilla Melissa A
Bought by
Petrilla Family Trust and Petrilla
Current Estimated Value
Purchase Details
Closed on
Mar 9, 2017
Sold by
Petrilla Marcus and Petrilla Melissa
Bought by
Petrilla Marcus A and Petrilla Melissa A
Home Financials for this Owner
Home Financials are based on the most recent Mortgage that was taken out on this home.
Original Mortgage
$341,250
Interest Rate
4.19%
Mortgage Type
New Conventional
Purchase Details
Closed on
Jan 29, 2015
Sold by
Reno Yard Llc
Bought by
Petrilla Marcus and Petrilla Melissa
Purchase Details
Closed on
Dec 17, 2004
Sold by
Rosaschi Geno O and Rosaschi Velda
Bought by
Reno Yard Llc
Home Financials for this Owner
Home Financials are based on the most recent Mortgage that was taken out on this home.
Original Mortgage
$515,024
Interest Rate
5.76%
Mortgage Type
Seller Take Back
Create a Home Valuation Report for This Property
The Home Valuation Report is an in-depth analysis detailing your home's value as well as a comparison with similar homes in the area
Home Values in the Area
Average Home Value in this Area
Purchase History
| Date | Buyer | Sale Price | Title Company |
|---|---|---|---|
| Petrilla Family Trust | -- | None Listed On Document | |
| Petrilla Marcus A | -- | Reliant Title | |
| Petrilla Marcus | $300,000 | First American Title Iv | |
| Reno Yard Llc | $718,000 | First American Title |
Source: Public Records
Mortgage History
| Date | Status | Borrower | Loan Amount |
|---|---|---|---|
| Previous Owner | Petrilla Marcus A | $341,250 | |
| Previous Owner | Reno Yard Llc | $515,024 |
Source: Public Records
Tax History Compared to Growth
Tax History
| Year | Tax Paid | Tax Assessment Tax Assessment Total Assessment is a certain percentage of the fair market value that is determined by local assessors to be the total taxable value of land and additions on the property. | Land | Improvement |
|---|---|---|---|---|
| 2025 | $3,618 | $146,315 | $79,170 | $67,145 |
| 2024 | $3,618 | $137,105 | $68,250 | $68,855 |
| 2023 | $3,513 | $127,607 | $61,425 | $66,182 |
| 2022 | $3,410 | $106,992 | $51,188 | $55,804 |
| 2021 | $3,311 | $102,887 | $46,615 | $56,272 |
| 2020 | $3,214 | $101,400 | $44,363 | $57,037 |
| 2019 | $3,120 | $100,550 | $44,363 | $56,187 |
| 2018 | $2,843 | $91,249 | $40,950 | $50,299 |
| 2017 | $1,800 | $60,385 | $40,950 | $19,435 |
| 2016 | $1,756 | $60,330 | $40,950 | $19,380 |
| 2015 | $875 | $54,020 | $35,000 | $19,020 |
| 2014 | $1,701 | $52,493 | $35,000 | $17,493 |
| 2013 | -- | $51,919 | $35,000 | $16,919 |
Source: Public Records
Map
Nearby Homes
- 55 Hidden Lake Dr
- 251 Theobald Ln
- 95 Hidden Lake Dr
- 330 Neilson Rd
- 315 Neilson Rd
- 307 Neilson Rd
- 20475 Temelec Way
- 95 Ox-Yoke Ln
- 1020 N Cantlon Ln
- 1255 Willomonte Rd
- 0 Chance Ln
- 40 Zircon Dr Unit 22
- 000 No Street Name
- 68 Zircon Dr
- 0 Rocky Vista Rd Unit 250056537
- 15770 Rocky Vista Rd
- 17144 Majestic View Dr
- 255 Zircon Dr
- 16260 Rhyolite Cir
- 4370 Great Falls Loop
- 17185 S Virginia St
- 17880 S Virginia St
- 17840 S Virginia St
- 17900 S Virginia St
- 170 Cheyenne Dr
- 17175 S Virginia St
- 17800 S Virginia St
- 17920 S Virginia St
- 17165 S Virginia St
- 17950 S Virginia St
- 101 Andrew Ln
- 150 Cheyenne Dr
- 105 Andrew Ln
- 165 Cheyenne Dr
- 120 Andrew Ln
- 140 Cheyenne Dr
- 16950 S Virginia St
- 17995 S Virginia St
- 130 Andrew Ln
- 155 Cheyenne Dr