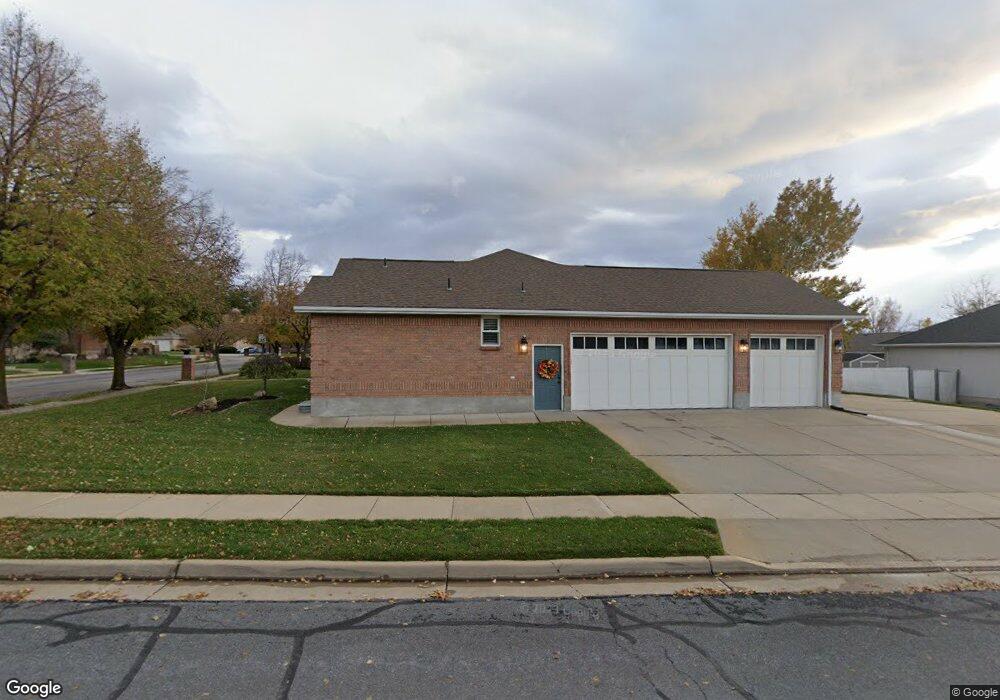
1787 N 300 W Centerville, UT 84014
Estimated Value: $859,000 - $954,403
5
Beds
5
Baths
4,858
Sq Ft
$186/Sq Ft
Est. Value
About This Home
This home is located at 1787 N 300 W, Centerville, UT 84014 and is currently estimated at $904,101, approximately $186 per square foot. 1787 N 300 W is a home located in Davis County with nearby schools including Reading School, Centerville Jr High, and Viewmont High School.
Ownership History
Date
Name
Owned For
Owner Type
Purchase Details
Closed on
Aug 25, 2022
Sold by
Mark Oligschlaeger
Bought by
Mark And Shae Oligschlaeger Trust
Current Estimated Value
Purchase Details
Closed on
Mar 25, 2009
Sold by
Utley Kathleen G
Bought by
Oligschlaeger Mark and Oligschlaeger Shae
Home Financials for this Owner
Home Financials are based on the most recent Mortgage that was taken out on this home.
Original Mortgage
$260,000
Interest Rate
5.15%
Mortgage Type
Purchase Money Mortgage
Create a Home Valuation Report for This Property
The Home Valuation Report is an in-depth analysis detailing your home's value as well as a comparison with similar homes in the area
Purchase History
We collect this data history from publicly available records. To have your information removed, we recommend requesting removal directly through your county’s website.
| Date | Buyer | Sale Price | Title Company |
|---|---|---|---|
| Mark And Shae Oligschlaeger Trust | -- | Ray Quinney & Nebeker Pc | |
| Oligschlaeger Mark | -- | Integrated Title Insurance S |
Source: Public Records
Mortgage History
We collect this data history from publicly available records. To have your information removed, we recommend requesting removal directly through your county’s website.
| Date | Status | Borrower | Loan Amount |
|---|---|---|---|
| Previous Owner | Oligschlaeger Mark | $260,000 |
Source: Public Records
Tax History
| Year | Tax Paid | Tax Assessment Tax Assessment Total Assessment is a certain percentage of the fair market value that is determined by local assessors to be the total taxable value of land and additions on the property. | Land | Improvement |
|---|---|---|---|---|
| 2025 | $5,174 | $459,250 | $142,826 | $316,424 |
| 2024 | $4,870 | $442,200 | $131,112 | $311,088 |
| 2023 | $4,666 | $771,000 | $211,467 | $559,533 |
| 2022 | $4,765 | $435,600 | $107,510 | $328,090 |
| 2021 | $4,365 | $620,000 | $168,190 | $451,810 |
| 2020 | $3,943 | $558,000 | $162,205 | $395,795 |
| 2019 | $3,983 | $554,000 | $155,804 | $398,196 |
| 2018 | $3,762 | $519,000 | $144,206 | $374,794 |
| 2016 | $3,338 | $258,335 | $57,235 | $201,100 |
| 2015 | $3,517 | $259,105 | $57,235 | $201,870 |
| 2014 | $3,673 | $279,070 | $57,235 | $221,835 |
| 2013 | -- | $222,374 | $45,935 | $176,439 |
Source: Public Records
Map
Nearby Homes
Your Personal Tour Guide
Ask me questions while you tour the home.