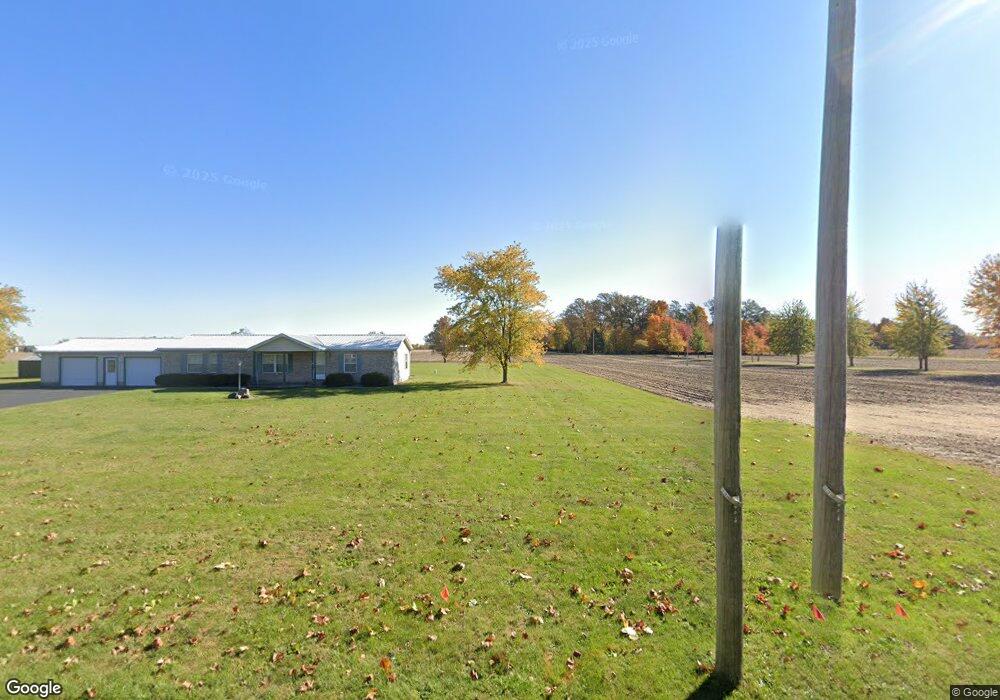
17870 E Shelby Rd New Knoxville, OH 45871
Estimated Value: $336,000 - $487,217
3
Beds
2
Baths
2,190
Sq Ft
$188/Sq Ft
Est. Value
About This Home
This home is located at 17870 E Shelby Rd, New Knoxville, OH 45871 and is currently estimated at $412,304, approximately $188 per square foot. 17870 E Shelby Rd is a home located in Shelby County with nearby schools including New Bremen Elementary School and New Bremen High School.
Ownership History
Date
Name
Owned For
Owner Type
Purchase Details
Closed on
Jul 6, 2016
Sold by
Mobley Wendell Lee
Bought by
Thompson Robert M and Thompson Janet G
Current Estimated Value
Home Financials for this Owner
Home Financials are based on the most recent Mortgage that was taken out on this home.
Original Mortgage
$300,000
Outstanding Balance
$136,486
Interest Rate
3.66%
Mortgage Type
New Conventional
Estimated Equity
$275,818
Purchase Details
Closed on
Mar 31, 2014
Sold by
Mallory Dennis D
Bought by
Mobley Wendell Lee
Purchase Details
Closed on
Oct 6, 2009
Sold by
Mallory Dennis D and Mallory Robyn
Bought by
Mallory Dennis D
Home Financials for this Owner
Home Financials are based on the most recent Mortgage that was taken out on this home.
Original Mortgage
$330,000
Interest Rate
5.15%
Mortgage Type
Reverse Mortgage Home Equity Conversion Mortgage
Create a Home Valuation Report for This Property
The Home Valuation Report is an in-depth analysis detailing your home's value as well as a comparison with similar homes in the area
Home Values in the Area
Average Home Value in this Area
Purchase History
| Date | Buyer | Sale Price | Title Company |
|---|---|---|---|
| Thompson Robert M | $375,000 | Attorney | |
| Mobley Wendell Lee | $204,000 | Attorney | |
| Mallory Dennis D | -- | Attorney |
Source: Public Records
Mortgage History
| Date | Status | Borrower | Loan Amount |
|---|---|---|---|
| Open | Thompson Robert M | $300,000 | |
| Previous Owner | Mallory Dennis D | $330,000 |
Source: Public Records
Tax History Compared to Growth
Tax History
| Year | Tax Paid | Tax Assessment Tax Assessment Total Assessment is a certain percentage of the fair market value that is determined by local assessors to be the total taxable value of land and additions on the property. | Land | Improvement |
|---|---|---|---|---|
| 2024 | $4,107 | $118,030 | $21,430 | $96,600 |
| 2023 | $4,107 | $118,710 | $21,430 | $97,280 |
| 2022 | $3,418 | $92,330 | $17,290 | $75,040 |
| 2021 | $3,377 | $92,330 | $17,290 | $75,040 |
| 2020 | $3,469 | $92,330 | $17,290 | $75,040 |
| 2019 | $2,949 | $79,140 | $13,850 | $65,290 |
| 2018 | $2,927 | $78,460 | $13,850 | $64,610 |
| 2017 | $2,934 | $78,460 | $13,850 | $64,610 |
| 2016 | $2,646 | $74,900 | $10,290 | $64,610 |
| 2015 | $2,576 | $74,900 | $10,290 | $64,610 |
| 2014 | $2,220 | $74,900 | $10,290 | $64,610 |
| 2013 | $2,188 | $69,530 | $10,290 | $59,240 |
Source: Public Records
Map
Nearby Homes
- 18000 E Shelby Rd
- 17928 E Shelby Rd
- 18000 E Shelby Rd
- 07120 Lock Two North Rd
- 07120 Lock Two North Rd
- 07120 Lock Two North Rd
- 07463 E Shelby Rd
- 5945 Lock Two Rd
- 5240 Botkins Rd
- 5166 Botkins Rd
- 5280 Botkins Rd
- 5848 Lock Two Rd
- 5620 Botkins Rd
- 0 Botkins Rd Unit B 276779
- 0 Botkins Rd Unit A 276781
- 0 Botkins Rd Unit 332663
- 0 Botkins Rd Unit B
- 17170 E Shelby Rd
- 5684 Botkins Rd
- 5677 Botkins Rd