Estimated Value: $362,000 - $389,000
3
Beds
2
Baths
1,318
Sq Ft
$281/Sq Ft
Est. Value
About This Home
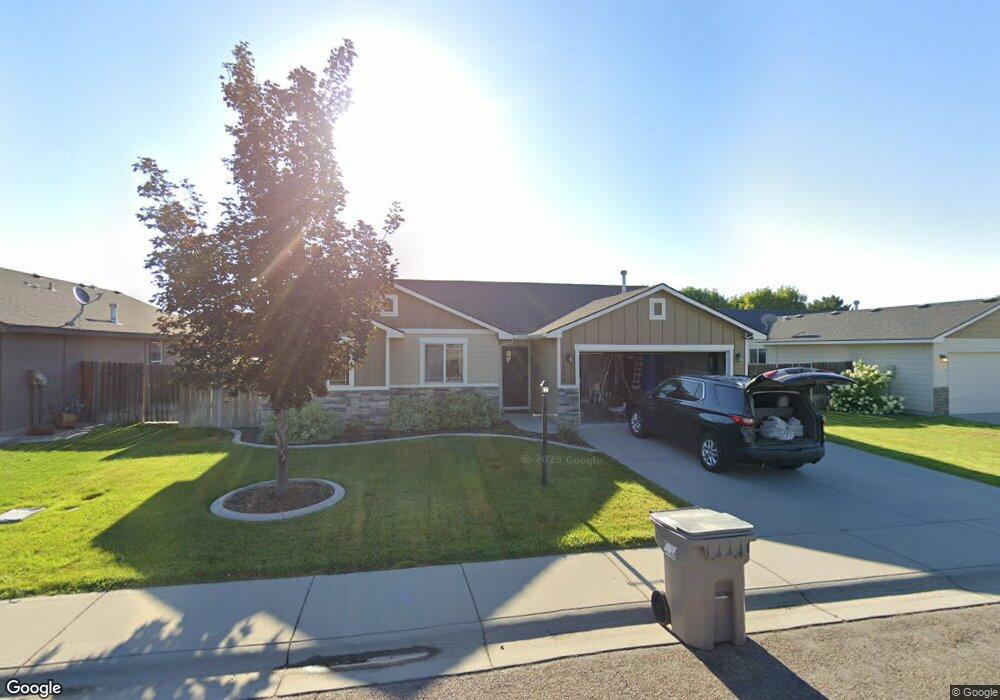
This home is located at 17874 Mountain Springs Ave, Nampa, ID 83687 and is currently estimated at $370,186, approximately $280 per square foot. 17874 Mountain Springs Ave is a home located in Canyon County with nearby schools including Desert Springs Elementary School, Sage Valley Middle School, and Ridgevue High School.
Ownership History
Date
Name
Owned For
Owner Type
Purchase Details
Closed on
Aug 5, 2021
Sold by
Leininger Danielle M and Leininger Ryan
Bought by
Leininger Danielle M and Leininger Ryan
Current Estimated Value
Purchase Details
Closed on
Dec 22, 2011
Sold by
Dlh Properties Llc
Bought by
Dinlus Danielle M
Home Financials for this Owner
Home Financials are based on the most recent Mortgage that was taken out on this home.
Original Mortgage
$3,146
Outstanding Balance
$2,142
Interest Rate
3.91%
Mortgage Type
Stand Alone Second
Estimated Equity
$368,044
Purchase Details
Closed on
Jun 30, 2010
Sold by
Team One Real Estate Services Inc
Bought by
Dlh Properties Llc
Purchase Details
Closed on
Apr 25, 2008
Sold by
Shur Luck Homes Inc
Bought by
Team One Real Estate Services Inc
Purchase Details
Closed on
Jan 3, 2008
Sold by
H & C Development Llc
Bought by
Shur Luck Homes Inc
Create a Home Valuation Report for This Property
The Home Valuation Report is an in-depth analysis detailing your home's value as well as a comparison with similar homes in the area
Home Values in the Area
Average Home Value in this Area
Purchase History
| Date | Buyer | Sale Price | Title Company |
|---|---|---|---|
| Leininger Danielle M | -- | Titleone Boise | |
| Dinlus Danielle M | -- | Titleone Boise | |
| Dlh Properties Llc | -- | Accommodation | |
| Team One Real Estate Services Inc | -- | Pioneer Title Company | |
| Shur Luck Homes Inc | -- | Pioneer Title Company |
Source: Public Records
Mortgage History
| Date | Status | Borrower | Loan Amount |
|---|---|---|---|
| Open | Dinlus Danielle M | $3,146 | |
| Open | Dinlus Danielle M | $81,719 |
Source: Public Records
Tax History Compared to Growth
Tax History
| Year | Tax Paid | Tax Assessment Tax Assessment Total Assessment is a certain percentage of the fair market value that is determined by local assessors to be the total taxable value of land and additions on the property. | Land | Improvement |
|---|---|---|---|---|
| 2025 | $1,355 | $343,900 | $127,000 | $216,900 |
| 2024 | $1,355 | $319,700 | $114,000 | $205,700 |
| 2023 | $1,299 | $323,500 | $114,000 | $209,500 |
| 2022 | $1,745 | $337,600 | $114,000 | $223,600 |
| 2021 | $1,696 | $258,200 | $69,500 | $188,700 |
| 2020 | $1,672 | $208,600 | $57,000 | $151,600 |
| 2019 | $1,648 | $192,800 | $47,500 | $145,300 |
| 2018 | $1,595 | $0 | $0 | $0 |
| 2017 | $1,539 | $0 | $0 | $0 |
| 2016 | $2,958 | $0 | $0 | $0 |
| 2015 | $2,626 | $0 | $0 | $0 |
| 2014 | $2,639 | $117,800 | $26,500 | $91,300 |
Source: Public Records
Map
Nearby Homes
- 17742 Mountain Springs Ave
- 17798 Mesa Springs Ave
- 10390 Scout Ridge St
- Brooke Plan at Adams Ridge
- Crestwood Plan at Adams Ridge
- Spruce Plan at Adams Ridge
- Everest Plan at Adams Ridge
- Alturas Plan at Adams Ridge
- Garnet Plan at Adams Ridge
- Evergreen Plan at Adams Ridge
- Yosemite Plan at Adams Ridge
- Birch Plan at Adams Ridge
- Ashton Plan at Adams Ridge
- Cypress Plan at Adams Ridge
- 17543 Colter Ridge Ave
- 17555 Colter Ridge Ave
- 10452 Bellevue Ridge St
- 10444 Bellevue Ridge St
- 10436 Bellevue Ridge St
- 17637 Mason Ridge Way
- 17862 Mountain Springs Ave
- 17896 Mountain Springs Ave
- 17875 Mountain Springs Ave
- 17887 Mountain Springs Ave
- 17850 Mountain Springs Ave
- 17863 Mountain Springs Ave
- TBD Longtail Dr
- 17816 Mountain Springs Ave
- 17851 Mountain Springs Ave
- TBD Barefoot Ridge Way
- 17838 Mountain Springs Ave
- TBD Blackpool Ridge St
- 10554 Long Tail Dr
- 17928 Mountain Springs Ave
- TBD Jackson Ridge Way
- 17839 Mountain Springs Ave
- 10566 Long Tail Dr
- 10554 Longtail Dr
- 17826 Mountain Springs Ave
- 17881 Sunset Ridge Ave