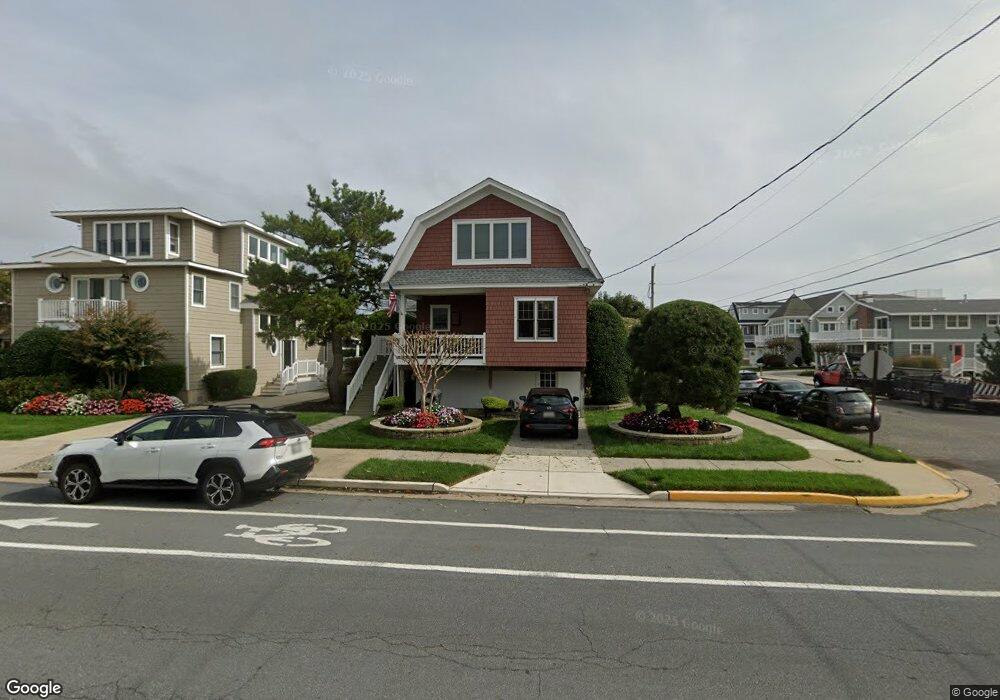
1789 Avalon Ave Avalon, NJ 08202
Estimated Value: $3,104,038 - $3,998,000
Studio
--
Bath
1,938
Sq Ft
$1,785/Sq Ft
Est. Value
About This Home
This home is located at 1789 Avalon Ave, Avalon, NJ 08202 and is currently estimated at $3,458,510, approximately $1,784 per square foot. 1789 Avalon Ave is a home located in Cape May County with nearby schools including Avalon Elementary School.
Ownership History
Date
Name
Owned For
Owner Type
Purchase Details
Closed on
May 20, 2021
Sold by
Hughes F Patrick
Bought by
Hughes F Patrick F and Hughes C C
Current Estimated Value
Purchase Details
Closed on
Aug 27, 2018
Sold by
Hughes Patrick F
Bought by
Hughes Patrick F and Hughes Campbell-Hughes C
Purchase Details
Closed on
Sep 18, 1998
Sold by
Slack Walter
Bought by
Hughes F Patrick
Home Financials for this Owner
Home Financials are based on the most recent Mortgage that was taken out on this home.
Original Mortgage
$39,600
Interest Rate
6.9%
Purchase Details
Closed on
Jun 12, 1992
Sold by
Rowan Iii Joseph I and Rowan Kathy B
Bought by
Slack Walter S and Slack Cheryl
Purchase Details
Closed on
Nov 9, 1990
Sold by
Rowan Mark M
Bought by
Rowan Joseph I and Rowan Kathy B
Purchase Details
Closed on
Jul 2, 1988
Sold by
Brown Walter
Bought by
Rowan Mark
Create a Home Valuation Report for This Property
The Home Valuation Report is an in-depth analysis detailing your home's value as well as a comparison with similar homes in the area
Home Values in the Area
Average Home Value in this Area
Purchase History
| Date | Buyer | Sale Price | Title Company |
|---|---|---|---|
| Hughes F Patrick F | -- | None Available | |
| Hughes Patrick F | -- | -- | |
| Hughes F Patrick | $495,500 | -- | |
| Slack Walter S | $356,000 | -- | |
| Rowan Joseph I | -- | -- | |
| Rowan Mark | $285,000 | -- |
Source: Public Records
Mortgage History
| Date | Status | Borrower | Loan Amount |
|---|---|---|---|
| Previous Owner | Hughes F Patrick | $39,600 |
Source: Public Records
Tax History
| Year | Tax Paid | Tax Assessment Tax Assessment Total Assessment is a certain percentage of the fair market value that is determined by local assessors to be the total taxable value of land and additions on the property. | Land | Improvement |
|---|---|---|---|---|
| 2025 | $11,025 | $1,795,600 | $1,775,000 | $20,600 |
| 2024 | $11,025 | $1,795,600 | $1,775,000 | $20,600 |
Source: Public Records
Map
Nearby Homes
Your Personal Tour Guide
Ask me questions while you tour the home.