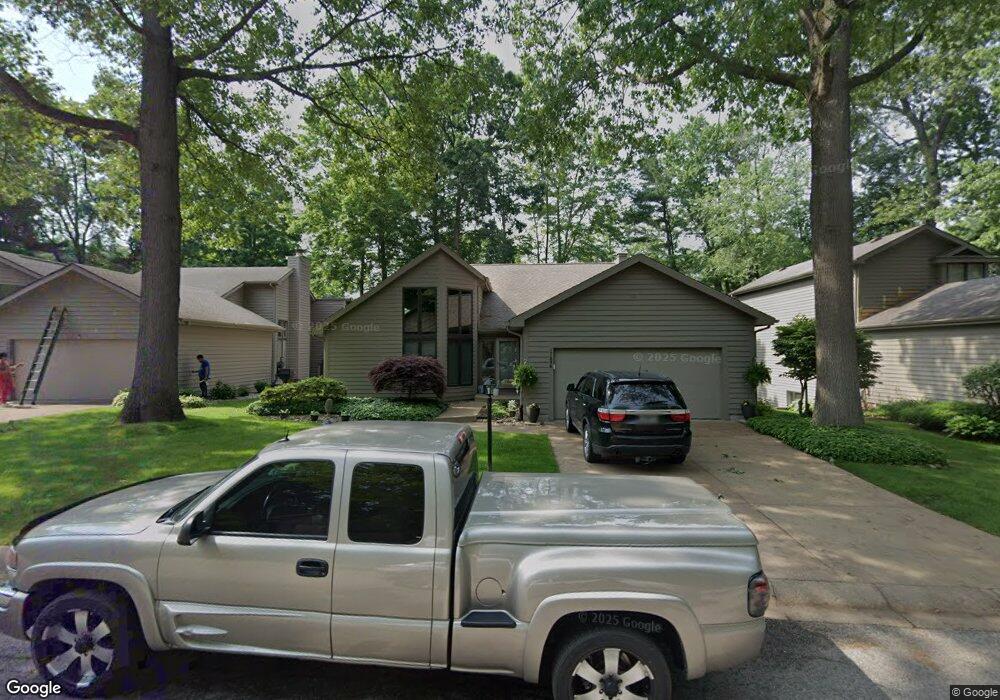
17896 Sable Ridge Dr South Bend, IN 46635
Estimated Value: $348,028 - $396,000
2
Beds
2
Baths
1,876
Sq Ft
$195/Sq Ft
Est. Value
About This Home
This home is located at 17896 Sable Ridge Dr, South Bend, IN 46635 and is currently estimated at $365,007, approximately $194 per square foot. 17896 Sable Ridge Dr is a home located in St. Joseph County with nearby schools including Clay Intermediate Center, Tarkington Traditional School, and Edison Middle School.
Ownership History
Date
Name
Owned For
Owner Type
Purchase Details
Closed on
May 27, 2020
Sold by
Roy Labere Living Trust
Bought by
Roy Labere Family Trust
Current Estimated Value
Purchase Details
Closed on
Oct 30, 2018
Sold by
Labere and Rosemary
Bought by
Roy Labere Living Trust and Rosemary Labere Living Trust
Purchase Details
Closed on
Sep 23, 2011
Sold by
Labere Roy A and Labere Rosemary L
Bought by
Labere Family Revocable Living Trust
Purchase Details
Closed on
May 15, 2008
Sold by
Dukes Harold R and Dukes Virginia M
Bought by
Bere Roy A La and Bere Rosemary L La
Home Financials for this Owner
Home Financials are based on the most recent Mortgage that was taken out on this home.
Original Mortgage
$177,600
Interest Rate
5.93%
Mortgage Type
New Conventional
Create a Home Valuation Report for This Property
The Home Valuation Report is an in-depth analysis detailing your home's value as well as a comparison with similar homes in the area
Home Values in the Area
Average Home Value in this Area
Purchase History
| Date | Buyer | Sale Price | Title Company |
|---|---|---|---|
| Roy Labere Family Trust | -- | None Listed On Document | |
| Roy Labere Living Trust | -- | None Listed On Document | |
| Labere Roy | -- | None Listed On Document | |
| Labere Family Revocable Living Trust | -- | None Available | |
| Bere Roy A La | -- | Metropolitian Title In Llc |
Source: Public Records
Mortgage History
| Date | Status | Borrower | Loan Amount |
|---|---|---|---|
| Previous Owner | Bere Roy A La | $177,600 |
Source: Public Records
Tax History Compared to Growth
Tax History
| Year | Tax Paid | Tax Assessment Tax Assessment Total Assessment is a certain percentage of the fair market value that is determined by local assessors to be the total taxable value of land and additions on the property. | Land | Improvement |
|---|---|---|---|---|
| 2024 | $3,508 | $355,600 | $65,400 | $290,200 |
| 2023 | $3,460 | $319,100 | $65,400 | $253,700 |
| 2022 | $3,989 | $325,900 | $65,400 | $260,500 |
| 2021 | $3,332 | $269,900 | $34,700 | $235,200 |
| 2020 | $3,050 | $247,600 | $31,900 | $215,700 |
| 2019 | $2,431 | $238,300 | $30,700 | $207,600 |
| 2018 | $2,425 | $218,400 | $27,800 | $190,600 |
| 2017 | $2,108 | $187,500 | $24,000 | $163,500 |
| 2016 | $2,149 | $187,500 | $24,000 | $163,500 |
| 2014 | $1,833 | $164,600 | $24,000 | $140,600 |
Source: Public Records
Map
Nearby Homes
- 52186 Woodridge Dr
- 18193 Windmill Ct
- 17633 Cobblestone Ct
- 18268 Burton Dr
- 18330 Farm Ln
- 51630 Waterford Ln
- 51766 Villager Pkwy
- 18391 Crownhill Dr
- 51793 Heath Ct
- 18268 Clairmont Dr
- 51824 Wembley Dr
- 17378 Woodhurst Rd
- 52145 Brookview Ct
- 18225 Amberly Ln
- 17328 Deerfield Loop
- 51527 Summer Hill Dr
- 52284 Farmington Square Rd
- TBD Emmons Rd
- 18120 Chipstead Dr
- 51757 Hickory Rd
- 17882 Sable Ridge Dr
- 17910 Sable Ridge Dr
- 17895 Amberwood Ln
- 17868 Sable Ridge Dr
- 17924 Sable Ridge Dr
- 17881 Amberwood Ln
- 17911 Amberwood Ln
- 17889 Sable Ridge Dr
- 17913 Sable Ridge Dr
- 17925 Amberwood Ln
- 17867 Amberwood Ln
- 17877 Sable Ridge Dr
- 17938 Sable Ridge Dr
- 17854 Sable Ridge Dr
- 17925 Sable Ridge Dr
- 17865 Sable Ridge Dr
- 17939 Amberwood Ln
- 17849 Amberwood Ln
- 17937 Sable Ridge Dr
- 17952 Sable Ridge Dr