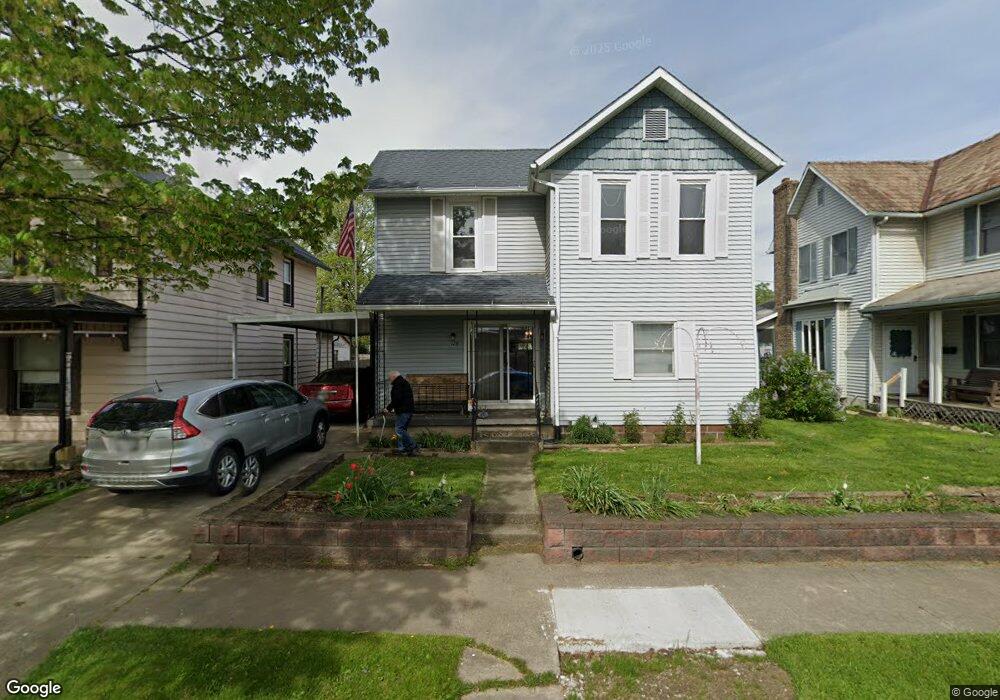
179 Boyleston Ave Unit A Newark, OH 43055
Estimated Value: $234,000 - $249,000
3
Beds
2
Baths
1,236
Sq Ft
$194/Sq Ft
Est. Value
About This Home
This home is located at 179 Boyleston Ave Unit A, Newark, OH 43055 and is currently estimated at $240,089, approximately $194 per square foot. 179 Boyleston Ave Unit A is a home located in Licking County with nearby schools including Carson Elementary School, Heritage Middle School, and Newark High School.
Ownership History
Date
Name
Owned For
Owner Type
Purchase Details
Closed on
Jul 7, 2025
Sold by
A New Way A New Day Llc
Bought by
Stokes Jennifer and Stokes Joshua
Current Estimated Value
Home Financials for this Owner
Home Financials are based on the most recent Mortgage that was taken out on this home.
Original Mortgage
$12,375
Outstanding Balance
$12,364
Interest Rate
6.67%
Estimated Equity
$227,725
Purchase Details
Closed on
May 12, 2025
Sold by
Mister Flipper Llc
Bought by
A New Way A New Day Llc
Home Financials for this Owner
Home Financials are based on the most recent Mortgage that was taken out on this home.
Original Mortgage
$243,016
Outstanding Balance
$242,590
Interest Rate
6.67%
Mortgage Type
FHA
Estimated Equity
-$2,501
Purchase Details
Closed on
Dec 12, 2024
Sold by
Lane Michael Eugene and Lane Cynthia
Bought by
Mister Flipper Llc
Home Financials for this Owner
Home Financials are based on the most recent Mortgage that was taken out on this home.
Original Mortgage
$119,000
Interest Rate
6.72%
Mortgage Type
Construction
Purchase Details
Closed on
Oct 11, 2010
Sold by
Federal Home Loan Mortgage Corporation
Bought by
Lane Wilbur E
Home Financials for this Owner
Home Financials are based on the most recent Mortgage that was taken out on this home.
Original Mortgage
$33,520
Interest Rate
4.26%
Mortgage Type
New Conventional
Purchase Details
Closed on
Jul 7, 2010
Sold by
North Mary L
Bought by
Federal Home Loan Mortgage Corp
Purchase Details
Closed on
Apr 7, 2005
Sold by
Estate Of John H North
Bought by
North Mary L
Create a Home Valuation Report for This Property
The Home Valuation Report is an in-depth analysis detailing your home's value as well as a comparison with similar homes in the area
Home Values in the Area
Average Home Value in this Area
Purchase History
| Date | Buyer | Sale Price | Title Company |
|---|---|---|---|
| Stokes Jennifer | $247,500 | None Listed On Document | |
| A New Way A New Day Llc | -- | None Listed On Document | |
| Mister Flipper Llc | $130,000 | None Listed On Document | |
| Lane Wilbur E | $41,900 | None Available | |
| Federal Home Loan Mortgage Corp | $40,000 | None Available | |
| North Mary L | -- | -- |
Source: Public Records
Mortgage History
| Date | Status | Borrower | Loan Amount |
|---|---|---|---|
| Open | Stokes Jennifer | $12,375 | |
| Open | Stokes Jennifer | $243,016 | |
| Previous Owner | Mister Flipper Llc | $119,000 | |
| Previous Owner | Lane Wilbur E | $33,520 |
Source: Public Records
Tax History Compared to Growth
Tax History
| Year | Tax Paid | Tax Assessment Tax Assessment Total Assessment is a certain percentage of the fair market value that is determined by local assessors to be the total taxable value of land and additions on the property. | Land | Improvement |
|---|---|---|---|---|
| 2024 | $1,274 | $45,400 | $6,230 | $39,170 |
| 2023 | $2,419 | $45,400 | $6,230 | $39,170 |
| 2022 | $741 | $27,130 | $4,060 | $23,070 |
| 2021 | $777 | $27,130 | $4,060 | $23,070 |
| 2020 | $794 | $27,130 | $4,060 | $23,070 |
| 2019 | $546 | $20,870 | $3,120 | $17,750 |
| 2018 | $540 | $0 | $0 | $0 |
| 2017 | $364 | $0 | $0 | $0 |
| 2016 | $201 | $0 | $0 | $0 |
| 2015 | $206 | $0 | $0 | $0 |
| 2014 | $781 | $0 | $0 | $0 |
| 2013 | $264 | $0 | $0 | $0 |
Source: Public Records
Map
Nearby Homes
- 174 Boyleston Ave
- 160 N Cedar St
- 167 Essex St
- 274 Boyleston Ave
- 232 Rosehill Ave
- 60 Dewey Ave
- 240 N Wing St
- 390 Cedarcrest Ave
- 491 Garfield Ave
- 81 Madison Ave
- 424 Ridge Ave
- 430 E Main St
- 554 Garfield Ave
- 392 Arlington Ave
- 51 Mill St
- 203 Lawrence St
- 452 Walnut Ln
- 194 Fielde Dr
- 483 Allston Ave
- 16 N Buena Vista St
- 173 Boyleston Ave
- 386 Indiana St
- 181 Boyleston Ave
- 388 Indiana St
- 388 E Indiana St
- 384 Indiana St
- 178 Boyleston Ave
- 182 Boyleston Ave
- 191 Boyleston Ave
- 168 Boyleston Ave
- 186 Boyleston Ave
- 193 Boyleston Ave
- 190 Boyleston Ave
- 154 N Cedar St
- 156 N Cedar St
- 152 N Cedar St
- 158 N Cedar St
- 194 Boyleston Ave
- 195 Boyleston Ave
- 150 N Cedar St