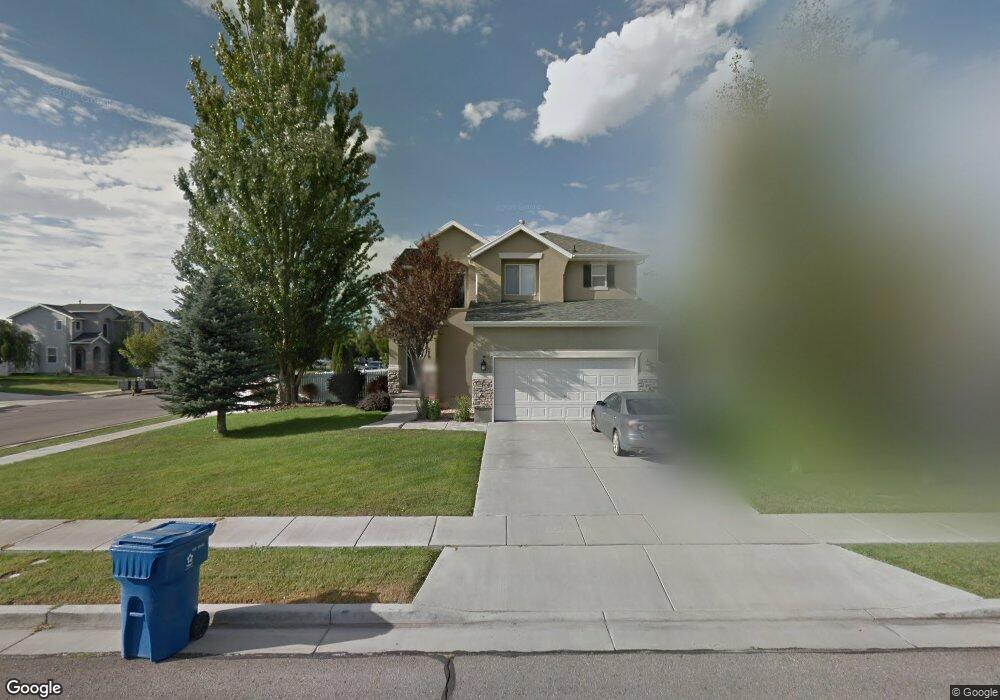
179 Clermont Ln Tooele, UT 84074
Estimated Value: $423,000 - $443,000
3
Beds
2
Baths
1,900
Sq Ft
$228/Sq Ft
Est. Value
About This Home
This home is located at 179 Clermont Ln, Tooele, UT 84074 and is currently estimated at $433,436, approximately $228 per square foot. 179 Clermont Ln is a home located in Tooele County with nearby schools including Rose Springs Elementary School, Clarke N. Johnsen Junior High School, and Stansbury High School.
Ownership History
Date
Name
Owned For
Owner Type
Purchase Details
Closed on
Jun 11, 2020
Sold by
Shiley Jade and Shiley Dominick
Bought by
Price Aaron and Solorzano Gloria
Current Estimated Value
Home Financials for this Owner
Home Financials are based on the most recent Mortgage that was taken out on this home.
Original Mortgage
$278,100
Outstanding Balance
$246,514
Interest Rate
3.2%
Mortgage Type
New Conventional
Estimated Equity
$186,922
Purchase Details
Closed on
Apr 29, 2015
Sold by
Winslow Bryce and Winslow Dani
Bought by
Shipley Jade and Shipley Dominick
Home Financials for this Owner
Home Financials are based on the most recent Mortgage that was taken out on this home.
Original Mortgage
$193,877
Interest Rate
3.73%
Mortgage Type
New Conventional
Create a Home Valuation Report for This Property
The Home Valuation Report is an in-depth analysis detailing your home's value as well as a comparison with similar homes in the area
Home Values in the Area
Average Home Value in this Area
Purchase History
| Date | Buyer | Sale Price | Title Company |
|---|---|---|---|
| Price Aaron | -- | Novation Title Ins Agcy | |
| Shipley Jade | -- | Cornerstone Title Insurance |
Source: Public Records
Mortgage History
| Date | Status | Borrower | Loan Amount |
|---|---|---|---|
| Open | Price Aaron | $278,100 | |
| Previous Owner | Shipley Jade | $193,877 |
Source: Public Records
Tax History Compared to Growth
Tax History
| Year | Tax Paid | Tax Assessment Tax Assessment Total Assessment is a certain percentage of the fair market value that is determined by local assessors to be the total taxable value of land and additions on the property. | Land | Improvement |
|---|---|---|---|---|
| 2025 | $3,109 | $392,968 | $132,000 | $260,968 |
| 2024 | $3,495 | $224,522 | $72,600 | $151,922 |
| 2023 | $3,495 | $211,633 | $77,550 | $134,083 |
| 2022 | $2,529 | $202,949 | $63,360 | $139,589 |
| 2021 | $2,219 | $147,059 | $55,110 | $91,949 |
| 2020 | $2,090 | $242,233 | $74,800 | $167,433 |
| 2019 | $2,044 | $233,035 | $74,800 | $158,235 |
| 2018 | $1,894 | $206,844 | $40,000 | $166,844 |
| 2017 | $1,722 | $198,899 | $40,000 | $158,899 |
| 2016 | $1,493 | $97,995 | $22,000 | $75,995 |
| 2015 | $1,493 | $93,694 | $0 | $0 |
| 2014 | -- | $93,694 | $0 | $0 |
Source: Public Records
Map
Nearby Homes
- 5546 Ardennes Way
- 198 Clermont Ln
- 5502 Ardennes Way
- 5493 Lorraine Way
- 107 Pebble Beach Dr
- 39 Strasbourg Ln
- 5581 Brienne Way
- 5454 Heather Way
- 5634 Miller Cir
- 5419 Heather Way
- 45 W Streams Edge Way
- 5584 N Gentle Breeze Ct
- 62 Fairway Dr
- 5489 Hampton Way
- 789 Country Club Dr
- 133 W Marigold Cir Unit 311
- 266 Country Club Dr
- 5718 Lanyard Ln
- 5675 Lanyard Ln
- 5229 N Ventura Cir
- 189 Clermont Ln
- 195 Clermont Ln
- 5523 Geneva Way
- 5550 Geneva Way
- 180 Clermont Ln
- 5513 Geneva Way
- 5541 Geneva Way
- 190 Clermont Ln
- 205 Clermont Ln
- 5551 Geneva Way
- 5562 Geneva Way
- 213 Clermont Ln
- 5495 Geneva Way
- 5524 Ardennes Way
- 5532 Ardennes Way
- 208 Clermont Ln
- 179 Cherbourg Ln
- 5561 Geneva Way
- 5516 Ardennes Way
- 5540 Ardennes Way