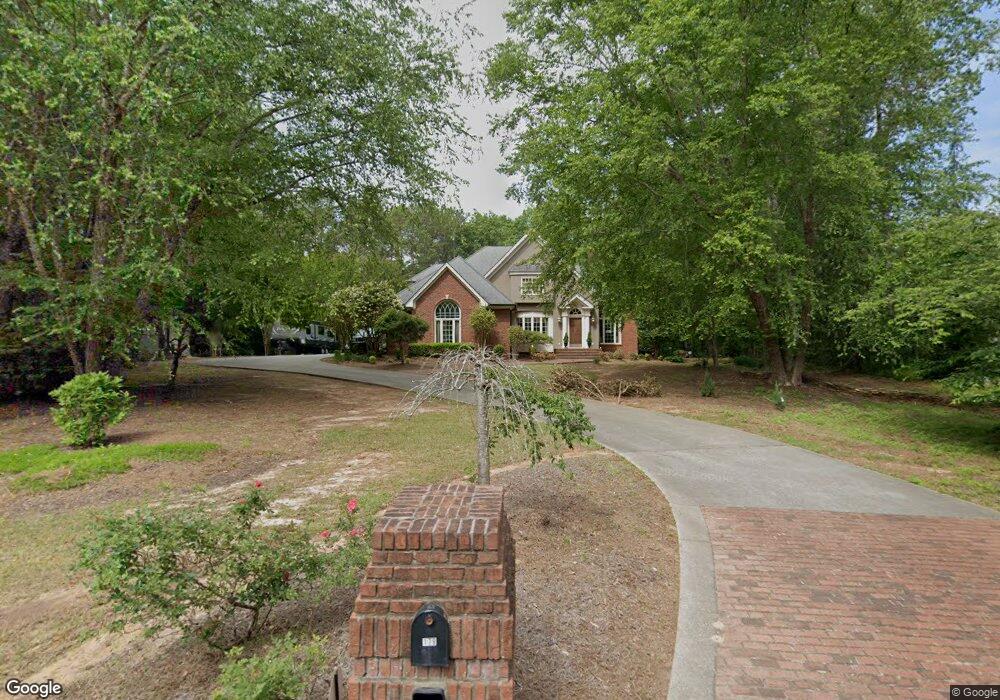
179 Cross Creek Dr Toccoa, GA 30577
Estimated Value: $412,000 - $554,000
3
Beds
4
Baths
3,137
Sq Ft
$159/Sq Ft
Est. Value
About This Home
This home is located at 179 Cross Creek Dr, Toccoa, GA 30577 and is currently estimated at $499,558, approximately $159 per square foot. 179 Cross Creek Dr is a home located in Stephens County with nearby schools including Stephens County High School.
Ownership History
Date
Name
Owned For
Owner Type
Purchase Details
Closed on
Nov 1, 2024
Sold by
Jarrett Henry S
Bought by
Scott Douglas E and Scott Elizabeth Jarrett
Current Estimated Value
Home Financials for this Owner
Home Financials are based on the most recent Mortgage that was taken out on this home.
Original Mortgage
$158,000
Outstanding Balance
$155,939
Interest Rate
6.12%
Mortgage Type
New Conventional
Estimated Equity
$343,619
Purchase Details
Closed on
Apr 28, 2017
Sold by
Terry Carter M
Bought by
Jarrett Henry S
Home Financials for this Owner
Home Financials are based on the most recent Mortgage that was taken out on this home.
Original Mortgage
$200,000
Interest Rate
4.14%
Mortgage Type
New Conventional
Purchase Details
Closed on
May 31, 2010
Sold by
Carter Terry
Bought by
Carter M Terry
Purchase Details
Closed on
Aug 30, 2005
Sold by
Randall Jane F
Bought by
Carter Terry
Purchase Details
Closed on
Oct 28, 2004
Bought by
Carter M Terry
Purchase Details
Closed on
Jun 1, 1996
Bought by
<Buyer Info Not Present>
Create a Home Valuation Report for This Property
The Home Valuation Report is an in-depth analysis detailing your home's value as well as a comparison with similar homes in the area
Purchase History
| Date | Buyer | Sale Price | Title Company |
|---|---|---|---|
| Scott Douglas E | $470,000 | -- | |
| Jarrett Henry S | $340,000 | -- | |
| Carter M Terry | -- | -- | |
| Carter M Terry | -- | -- | |
| Carter Terry | $20,778 | -- | |
| Carter M Terry | $340,000 | -- | |
| <Buyer Info Not Present> | $250,000 | -- |
Source: Public Records
Mortgage History
| Date | Status | Borrower | Loan Amount |
|---|---|---|---|
| Open | Scott Douglas E | $158,000 | |
| Previous Owner | Jarrett Henry S | $200,000 |
Source: Public Records
Tax History
| Year | Tax Paid | Tax Assessment Tax Assessment Total Assessment is a certain percentage of the fair market value that is determined by local assessors to be the total taxable value of land and additions on the property. | Land | Improvement |
|---|---|---|---|---|
| 2025 | $6,833 | $231,419 | $7,684 | $223,735 |
| 2024 | $5,587 | $158,430 | $7,684 | $150,746 |
| 2023 | $5,176 | $148,009 | $7,684 | $140,325 |
| 2022 | $4,153 | $141,504 | $7,684 | $133,820 |
| 2021 | $4,092 | $132,854 | $7,684 | $125,170 |
| 2020 | $4,133 | $132,887 | $7,684 | $125,203 |
| 2019 | $4,214 | $132,887 | $7,684 | $125,203 |
| 2018 | $4,214 | $132,887 | $7,684 | $125,203 |
| 2017 | $3,690 | $116,570 | $7,318 | $109,252 |
| 2016 | $3,633 | $116,569 | $7,318 | $109,251 |
| 2015 | $3,802 | $116,489 | $7,318 | $109,171 |
| 2014 | $3,934 | $118,537 | $9,366 | $109,171 |
| 2013 | -- | $118,742 | $9,365 | $109,376 |
Source: Public Records
Map
Nearby Homes
- 694 Lovers Ln
- 391 Rosedale St
- 117 Glencrest Dr
- 593 Cross Creek Dr
- 148 Moreland Dr
- 0 E Currahee St Unit 10544607
- 29 Mountain View Dr
- 43 Mountain View Dr
- 129 Brady St
- 73 Ridgeview Heights
- 90 Elm Dr
- 110 Valley Rd
- 811 Prather Bridge Rd
- 899 E Doyle St
- 327 Ayers Creek Dr
- 1168 Rosedale St
- 45 Hayes St
- 84 Oak Creek Cir
- 345 Prather Bridge Rd
- 41 Norwood Ave
- 1015 Lovers Ln
- 223 Cross Creek Dr
- 987 Lovers Ln
- 152 Cross Creek Dr
- 83 Cross Creek Dr
- 226 Cross Creek Dr
- 116 Cross Creek Dr
- 243 Cross Creek Dr
- 270 Cross Creek Dr
- 293 Cross Creek Dr
- 21 Cross Creek Dr
- 100 Cross Creek Dr
- 921 Lovers Ln
- 78 Cross Creek Dr
- 8512 Lovers Ln
- 739 Lovers Ln
- 430 Cross Creek Dr
- 430 Cross Creek Dr Unit Lot 15
- 12 Cross Creek Dr
- 0 Cross Creek Dr Unit 15 8238770
Your Personal Tour Guide
Ask me questions while you tour the home.