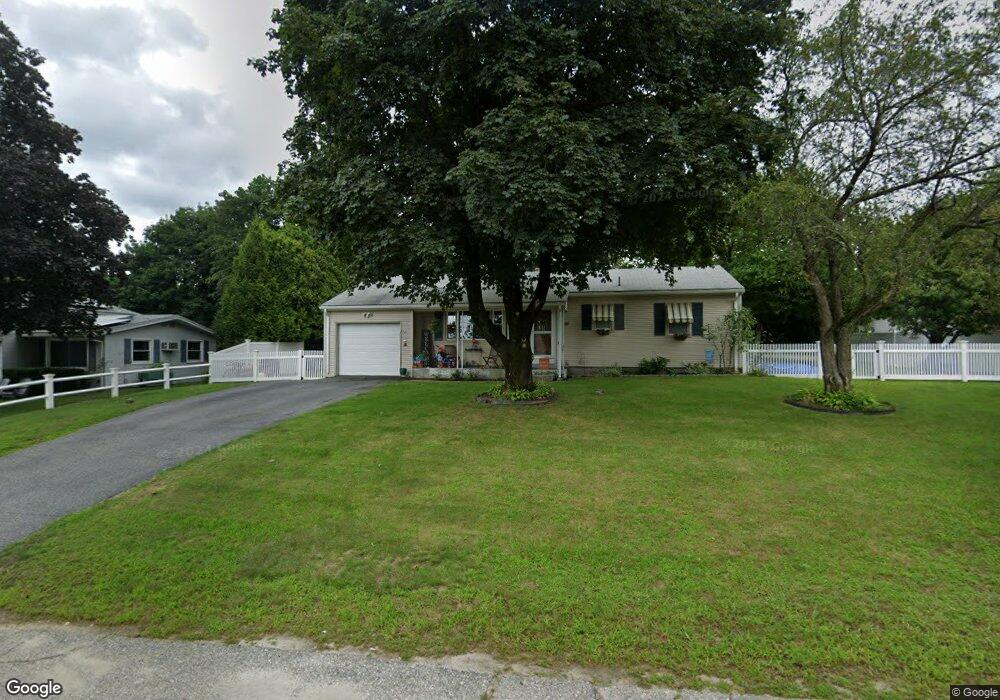
179 Dawn Blvd Woonsocket, RI 02895
East Woonsocket NeighborhoodEstimated Value: $383,000 - $421,000
3
Beds
2
Baths
1,484
Sq Ft
$273/Sq Ft
Est. Value
About This Home
This home is located at 179 Dawn Blvd, Woonsocket, RI 02895 and is currently estimated at $404,403, approximately $272 per square foot. 179 Dawn Blvd is a home located in Providence County with nearby schools including Woonsocket High School, Rise Prep Mayoral Academy Middle School, and Mercymount Country Day School.
Ownership History
Date
Name
Owned For
Owner Type
Purchase Details
Closed on
Dec 31, 2009
Sold by
Aslam Mansoor
Bought by
Morin Matthew and Morin Amy
Current Estimated Value
Home Financials for this Owner
Home Financials are based on the most recent Mortgage that was taken out on this home.
Original Mortgage
$147,283
Outstanding Balance
$94,645
Interest Rate
4.85%
Mortgage Type
Purchase Money Mortgage
Estimated Equity
$309,758
Purchase Details
Closed on
Apr 9, 2007
Sold by
Waged Fatima N
Bought by
Aslam Mansoor
Home Financials for this Owner
Home Financials are based on the most recent Mortgage that was taken out on this home.
Original Mortgage
$250,800
Interest Rate
6.25%
Mortgage Type
Purchase Money Mortgage
Purchase Details
Closed on
Nov 27, 2001
Sold by
Alexis Chubka and Cavallo Christine M
Bought by
Ali Liaqat
Create a Home Valuation Report for This Property
The Home Valuation Report is an in-depth analysis detailing your home's value as well as a comparison with similar homes in the area
Home Values in the Area
Average Home Value in this Area
Purchase History
| Date | Buyer | Sale Price | Title Company |
|---|---|---|---|
| Morin Matthew | $150,000 | -- | |
| Aslam Mansoor | $264,000 | -- | |
| Ali Liaqat | $138,000 | -- | |
| Morin Matthew | $150,000 | -- | |
| Aslam Mansoor | $264,000 | -- | |
| Ali Liaqat | $138,000 | -- |
Source: Public Records
Mortgage History
| Date | Status | Borrower | Loan Amount |
|---|---|---|---|
| Open | Ali Liaqat | $147,283 | |
| Closed | Ali Liaqat | $147,283 | |
| Previous Owner | Ali Liaqat | $250,800 |
Source: Public Records
Tax History
| Year | Tax Paid | Tax Assessment Tax Assessment Total Assessment is a certain percentage of the fair market value that is determined by local assessors to be the total taxable value of land and additions on the property. | Land | Improvement |
|---|---|---|---|---|
| 2025 | $4,248 | $378,300 | $108,000 | $270,300 |
| 2024 | $3,747 | $257,700 | $88,100 | $169,600 |
| 2023 | $3,603 | $257,700 | $88,100 | $169,600 |
| 2022 | $3,603 | $257,700 | $88,100 | $169,600 |
| 2021 | $4,045 | $170,300 | $70,800 | $99,500 |
| 2020 | $4,087 | $170,300 | $70,800 | $99,500 |
| 2018 | $4,101 | $170,300 | $70,800 | $99,500 |
| 2017 | $4,542 | $150,900 | $65,400 | $85,500 |
| 2016 | $4,805 | $150,900 | $65,400 | $85,500 |
| 2015 | $5,520 | $150,900 | $65,400 | $85,500 |
| 2014 | $3,955 | $157,200 | $72,000 | $85,200 |
Source: Public Records
Map
Nearby Homes
- 20 Nature View Dr
- 25 Nature View Dr
- 9 Pebble Cir Unit 9
- 24 Palmetto Dr Unit 24
- 21 Palmetto Dr Unit 21
- 365 W Wrentham Rd
- 65 Palmetto Dr Unit 65
- 4 Carnation St
- 9 Brookfield Ln
- 180 Pine Swamp Rd
- 56 Pine Swamp Rd
- 727 Mendon Rd
- 172 Pine Swamp Rd
- 202 Paine St
- 95 Mitris Blvd
- 194 Paine St
- 1250 Pulaski Blvd
- 82 Paine St
- 101 Pine Grove Ave
- 68 Kenwood St
Your Personal Tour Guide
Ask me questions while you tour the home.