Estimated Value: $827,000 - $1,005,971
4
Beds
3
Baths
2,344
Sq Ft
$390/Sq Ft
Est. Value
About This Home
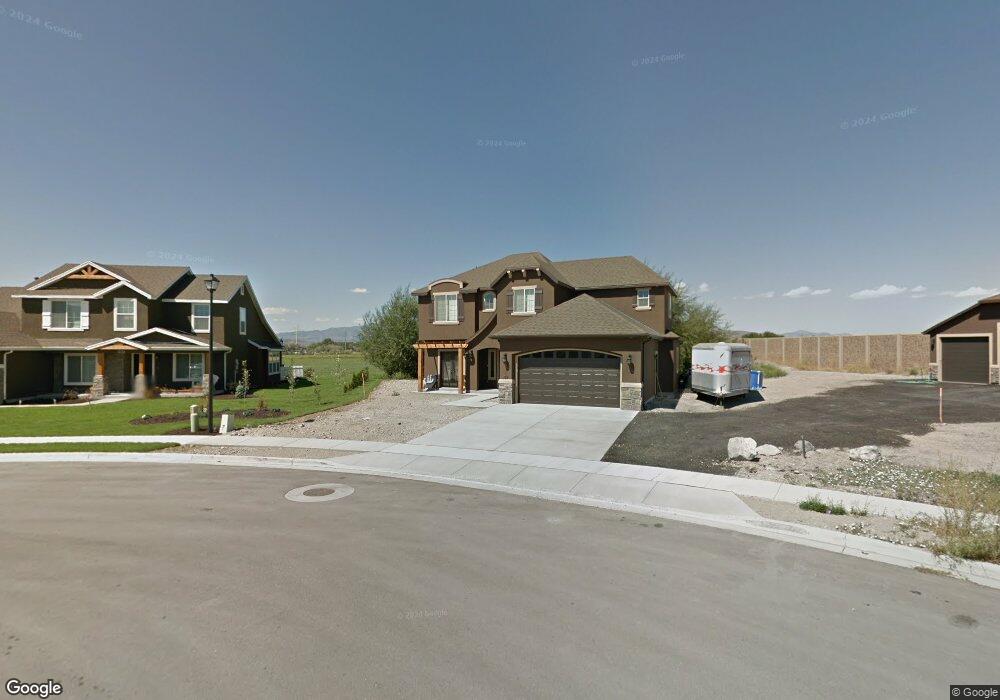
This home is located at 179 E 1210 S Unit 6, Lehi, UT 84043 and is currently estimated at $914,243, approximately $390 per square foot. 179 E 1210 S Unit 6 is a home located in Utah County with nearby schools including Dry Creek Elementary School, Lehi Junior High School, and Lehi High School.
Ownership History
Date
Name
Owned For
Owner Type
Purchase Details
Closed on
Feb 17, 2017
Sold by
Mitchell Bodi S
Bought by
Krantz Jeffrey Dylan
Current Estimated Value
Home Financials for this Owner
Home Financials are based on the most recent Mortgage that was taken out on this home.
Original Mortgage
$355,000
Outstanding Balance
$293,925
Interest Rate
4.2%
Mortgage Type
New Conventional
Estimated Equity
$620,318
Purchase Details
Closed on
Apr 12, 2012
Sold by
Central Bank
Bought by
Salisbury Developers Inc
Home Financials for this Owner
Home Financials are based on the most recent Mortgage that was taken out on this home.
Original Mortgage
$170,900
Interest Rate
3.86%
Mortgage Type
Purchase Money Mortgage
Purchase Details
Closed on
Dec 24, 2008
Sold by
Lehi Willows Estates Development Llc
Bought by
Central Bank
Create a Home Valuation Report for This Property
The Home Valuation Report is an in-depth analysis detailing your home's value as well as a comparison with similar homes in the area
Home Values in the Area
Average Home Value in this Area
Purchase History
| Date | Buyer | Sale Price | Title Company |
|---|---|---|---|
| Krantz Jeffrey Dylan | -- | Provo Land Title Co | |
| Salisbury Developers Inc | -- | Provoland Title Comany | |
| Central Bank | $3,850,000 | None Available |
Source: Public Records
Mortgage History
| Date | Status | Borrower | Loan Amount |
|---|---|---|---|
| Open | Krantz Jeffrey Dylan | $355,000 | |
| Previous Owner | Salisbury Developers Inc | $170,900 |
Source: Public Records
Tax History Compared to Growth
Tax History
| Year | Tax Paid | Tax Assessment Tax Assessment Total Assessment is a certain percentage of the fair market value that is determined by local assessors to be the total taxable value of land and additions on the property. | Land | Improvement |
|---|---|---|---|---|
| 2025 | $3,704 | $482,900 | $350,700 | $527,300 |
| 2024 | $3,704 | $433,510 | $0 | $0 |
| 2023 | $3,415 | $433,895 | $0 | $0 |
| 2022 | $3,249 | $400,180 | $0 | $0 |
| 2021 | $2,853 | $531,300 | $203,000 | $328,300 |
| 2020 | $2,688 | $494,800 | $188,000 | $306,800 |
| 2019 | $2,431 | $465,300 | $188,000 | $277,300 |
| 2018 | $2,347 | $424,600 | $183,500 | $241,100 |
| 2017 | $2,180 | $209,660 | $0 | $0 |
| 2016 | $2,300 | $205,260 | $0 | $0 |
| 2015 | $2,211 | $187,330 | $0 | $0 |
| 2014 | $2,048 | $172,425 | $0 | $0 |
Source: Public Records
Map
Nearby Homes
- 1201 S 100 E Unit 1
- 1204 S 50 E Unit 1
- 793 S 350 E
- 464 E 800 S
- Adagio Plan at Grandeur Estates
- Ballad Plan at Grandeur Estates
- Interlude Plan at Grandeur Estates
- Trio Plan at Grandeur Estates
- Forte Plan at Grandeur Estates
- Tenor Plan at Grandeur Estates
- Staccato Plan at Grandeur Estates
- Prelude Plan at Grandeur Estates
- Octave Plan at Grandeur Estates
- Finale Plan at Grandeur Estates
- Harrison Plan at Grandeur Estates
- Crescendo Plan at Grandeur Estates
- Timpani Plan at Grandeur Estates
- Harvard Plan at Grandeur Estates
- Treble Plan at Grandeur Estates
- Browning Plan at Grandeur Estates
- 179 E 1210 S
- 209 E 1210 S Unit 5
- 209 E 1210 S
- 1232 S 200 E Unit 7
- 229 E 1210 S Unit 4
- 229 E 1210 S
- 1201 S 100 E Unit 3
- 1201 S 100 E Unit 4
- 1233 S 100 E Unit 4
- 1250 S 200 E Unit 8
- 1250 S 200 E
- 1237 S 200 E Unit 10
- 1237 S 200 E
- 208 E 1130 S Unit 33
- 208 E 1130 S
- 1257 S 200 E
- 1257 S 200 E Unit 11
- 249 E 1210 S Unit 3
- 249 E 1210 S
- 226 E 1130 S Unit 34