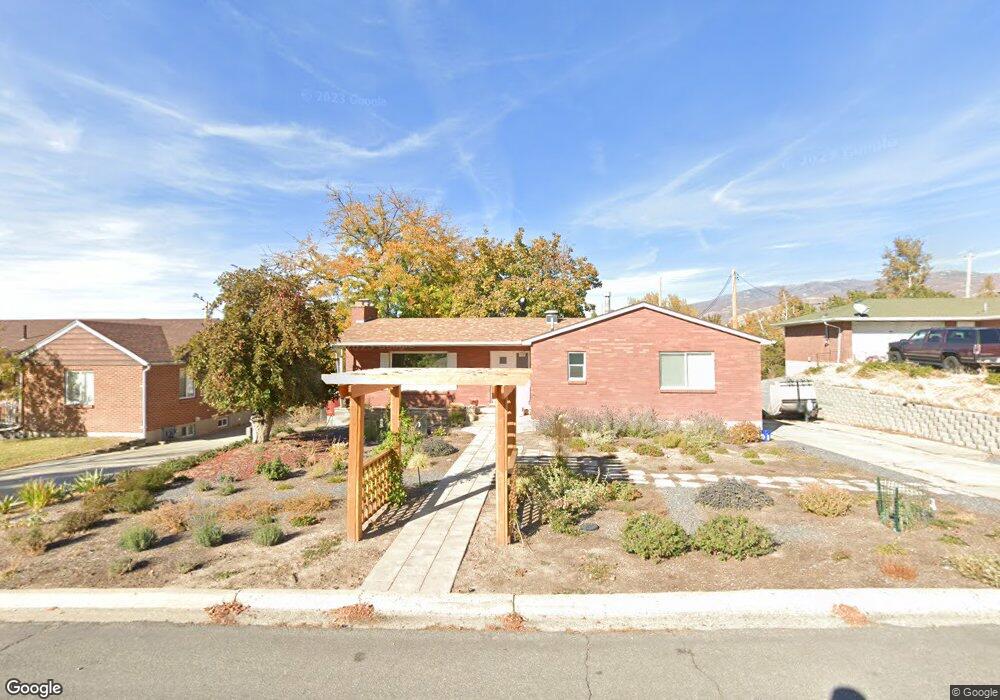
179 E 2450 S Bountiful, UT 84010
Estimated Value: $494,000 - $570,000
5
Beds
2
Baths
2,170
Sq Ft
$245/Sq Ft
Est. Value
About This Home
This home is located at 179 E 2450 S, Bountiful, UT 84010 and is currently estimated at $532,335, approximately $245 per square foot. 179 E 2450 S is a home located in Davis County with nearby schools including Muir School, Mueller Park Junior High School, and Woods Cross High School.
Ownership History
Date
Name
Owned For
Owner Type
Purchase Details
Closed on
Nov 9, 2016
Sold by
Farver Shane
Bought by
Farver Shane and Dalloff Melissa M
Current Estimated Value
Home Financials for this Owner
Home Financials are based on the most recent Mortgage that was taken out on this home.
Original Mortgage
$215,920
Outstanding Balance
$173,538
Interest Rate
3.54%
Estimated Equity
$358,797
Purchase Details
Closed on
Apr 29, 2016
Sold by
Debby Otoole
Bought by
Bartholomew Brian
Purchase Details
Closed on
Feb 22, 2005
Sold by
Otoole Bernard R and Otoole Joyce M
Bought by
Otoole B R and Otoole Joyce M
Home Financials for this Owner
Home Financials are based on the most recent Mortgage that was taken out on this home.
Original Mortgage
$244,500
Interest Rate
4.46%
Mortgage Type
FHA
Purchase Details
Closed on
Sep 3, 1999
Sold by
Otoole Bernard R and Otoole Joyce M
Bought by
Otoole B R and Otoole Joyce M
Create a Home Valuation Report for This Property
The Home Valuation Report is an in-depth analysis detailing your home's value as well as a comparison with similar homes in the area
Purchase History
| Date | Buyer | Sale Price | Title Company |
|---|---|---|---|
| Farver Shane | -- | First American Title | |
| Farver Shane | -- | Meridian Title | |
| Bartholomew Brian | -- | Meridian Title | |
| Otoole B R | -- | -- | |
| Otoole Bernard R | -- | Equity Title Ins Agency Inc | |
| Otoole B R | -- | -- |
Source: Public Records
Mortgage History
| Date | Status | Borrower | Loan Amount |
|---|---|---|---|
| Open | Farver Shane | $215,920 | |
| Previous Owner | Otoole Bernard R | $244,500 |
Source: Public Records
Tax History
| Year | Tax Paid | Tax Assessment Tax Assessment Total Assessment is a certain percentage of the fair market value that is determined by local assessors to be the total taxable value of land and additions on the property. | Land | Improvement |
|---|---|---|---|---|
| 2025 | $2,875 | $254,650 | $145,987 | $108,663 |
| 2024 | $2,676 | $246,400 | $134,781 | $111,619 |
| 2023 | $2,572 | $430,000 | $243,926 | $186,074 |
| 2022 | $2,719 | $250,250 | $132,123 | $118,127 |
| 2021 | $2,344 | $329,000 | $173,083 | $155,917 |
| 2020 | $2,081 | $292,000 | $146,281 | $145,719 |
| 2019 | $2,120 | $291,000 | $144,221 | $146,779 |
| 2018 | $1,968 | $265,000 | $141,145 | $123,855 |
| 2016 | $1,615 | $117,040 | $60,875 | $56,165 |
| 2015 | $1,591 | $108,130 | $60,875 | $47,255 |
| 2014 | $17 | $110,472 | $60,875 | $49,597 |
| 2013 | -- | $114,859 | $52,579 | $62,280 |
Source: Public Records
Map
Nearby Homes
- 2292 S 250 E
- 2273 S 200 E
- 110 2250 S
- 69 E North Canyon Rd
- 19 E North Canyon Rd
- 320 E 2100 S
- 41 E 2200 S
- 188 E 2050 S Unit D3
- 296 E 2050 S Unit 2
- 2046 S 350 E Unit 4
- 2053 S 350 E Unit 7
- 295 E 2050 S Unit 1
- 2038 S 350 E Unit 3
- 2064 S Orchard Dr
- 2059 S 350 E Unit 6
- 2 E Wicker Ln
- 610 Meadowlark Ln
- 1886 S Jeri Dr
- 1820 S 50 W
- 761 San Simeon Way
Your Personal Tour Guide
Ask me questions while you tour the home.