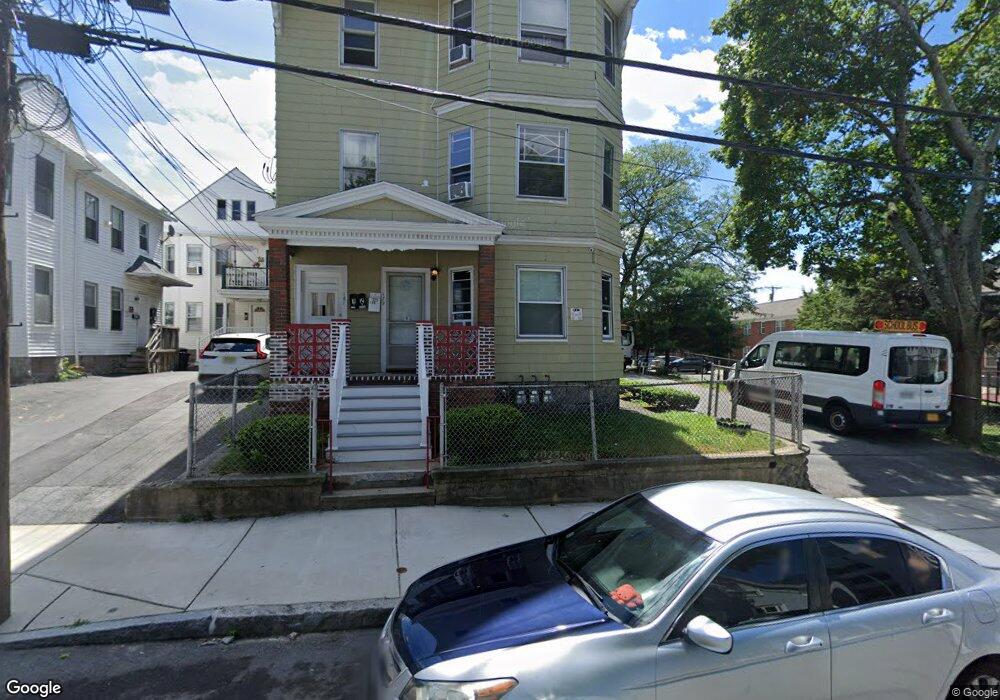
179 Farnham St Unit 181 Lawrence, MA 01843
South Common NeighborhoodEstimated Value: $787,990 - $871,000
9
Beds
3
Baths
3,690
Sq Ft
$227/Sq Ft
Est. Value
About This Home
This home is located at 179 Farnham St Unit 181, Lawrence, MA 01843 and is currently estimated at $837,498, approximately $226 per square foot. 179 Farnham St Unit 181 is a home located in Essex County with nearby schools including Vardaman Elementary School, Olive Branch Elementary School, and Rowan Elementary School.
Ownership History
Date
Name
Owned For
Owner Type
Purchase Details
Closed on
Apr 27, 2021
Sold by
Paula Santo E and Depaula Alejandrina
Bought by
Paula Erika
Current Estimated Value
Purchase Details
Closed on
Apr 22, 2019
Sold by
Thu Truong 2013 T
Bought by
Paula Santo E and Depaula Alejandrina
Home Financials for this Owner
Home Financials are based on the most recent Mortgage that was taken out on this home.
Original Mortgage
$466,450
Interest Rate
4.1%
Mortgage Type
New Conventional
Purchase Details
Closed on
Apr 25, 2013
Sold by
Thu Sui V and Truong Muoi
Bought by
Thu Truong T and Thu Sui V
Purchase Details
Closed on
Jun 2, 1993
Sold by
Meridian Mtg Corp
Bought by
Thu Sui
Home Financials for this Owner
Home Financials are based on the most recent Mortgage that was taken out on this home.
Original Mortgage
$52,650
Interest Rate
7.33%
Mortgage Type
Purchase Money Mortgage
Purchase Details
Closed on
Jun 22, 1988
Sold by
Section 1031 Tr
Bought by
Alvarez Raul S
Home Financials for this Owner
Home Financials are based on the most recent Mortgage that was taken out on this home.
Original Mortgage
$157,500
Interest Rate
10.32%
Mortgage Type
Purchase Money Mortgage
Create a Home Valuation Report for This Property
The Home Valuation Report is an in-depth analysis detailing your home's value as well as a comparison with similar homes in the area
Home Values in the Area
Average Home Value in this Area
Purchase History
| Date | Buyer | Sale Price | Title Company |
|---|---|---|---|
| Paula Erika | -- | None Available | |
| Paula Santo E | $491,000 | -- | |
| Thu Truong T | -- | -- | |
| Thu Sui | $58,500 | -- | |
| Alvarez Raul S | $175,000 | -- |
Source: Public Records
Mortgage History
| Date | Status | Borrower | Loan Amount |
|---|---|---|---|
| Previous Owner | Paula Santo E | $466,450 | |
| Previous Owner | Alvarez Raul S | $52,650 | |
| Previous Owner | Alvarez Raul S | $157,500 |
Source: Public Records
Tax History Compared to Growth
Tax History
| Year | Tax Paid | Tax Assessment Tax Assessment Total Assessment is a certain percentage of the fair market value that is determined by local assessors to be the total taxable value of land and additions on the property. | Land | Improvement |
|---|---|---|---|---|
| 2025 | $5,887 | $669,000 | $114,600 | $554,400 |
| 2024 | $5,974 | $645,800 | $124,000 | $521,800 |
| 2023 | $5,671 | $558,200 | $115,000 | $443,200 |
| 2022 | $5,404 | $472,400 | $104,300 | $368,100 |
| 2021 | $5,140 | $418,900 | $104,300 | $314,600 |
| 2020 | $4,952 | $398,400 | $98,900 | $299,500 |
| 2019 | $4,897 | $358,000 | $82,200 | $275,800 |
| 2018 | $4,600 | $321,200 | $77,800 | $243,400 |
| 2017 | $4,133 | $269,400 | $73,500 | $195,900 |
| 2016 | $4,016 | $258,900 | $60,500 | $198,400 |
| 2015 | $3,940 | $260,600 | $60,500 | $200,100 |
Source: Public Records
Map
Nearby Homes
- 356-360 S Union St
- 111 Cambridge St Unit D
- 91 Farnham St
- 27-29 Dorchester St
- 67-69 Osgood St
- 78-80 Osgood St
- 64 Salem St
- 77-79 Shawsheen Rd
- 46 Loring St
- 80 Market St
- 132-134 S Broadway
- 19 Front St
- 82 S Broadway
- 5 Lafayette Ave
- 13 Kingston St
- 49 Bowdoin St Unit 51
- 24 Inman St Unit 32
- 41 Durham St
- 57 Glenwood St
- 317 Middlesex St
- 183 Farnham St Unit 189
- 187 Farnham St
- 191 Farnham St
- 182 Andover St
- 172 Andover St Unit 176
- 195 Farnham St Unit 197
- 176 Farnham St
- 200 S Union St Unit 206
- 170 Andover St
- 178 Farnham St Unit 182
- 198 S Union St
- 186 Farnham St
- 200-206 South Union
- 166 Andover St Unit 168
- 198-206 South Union
- 166-168 Andover St
- 190 Farnham St
- 239 S Union St
- 205 S Union St Unit 211
- 211 S Union St