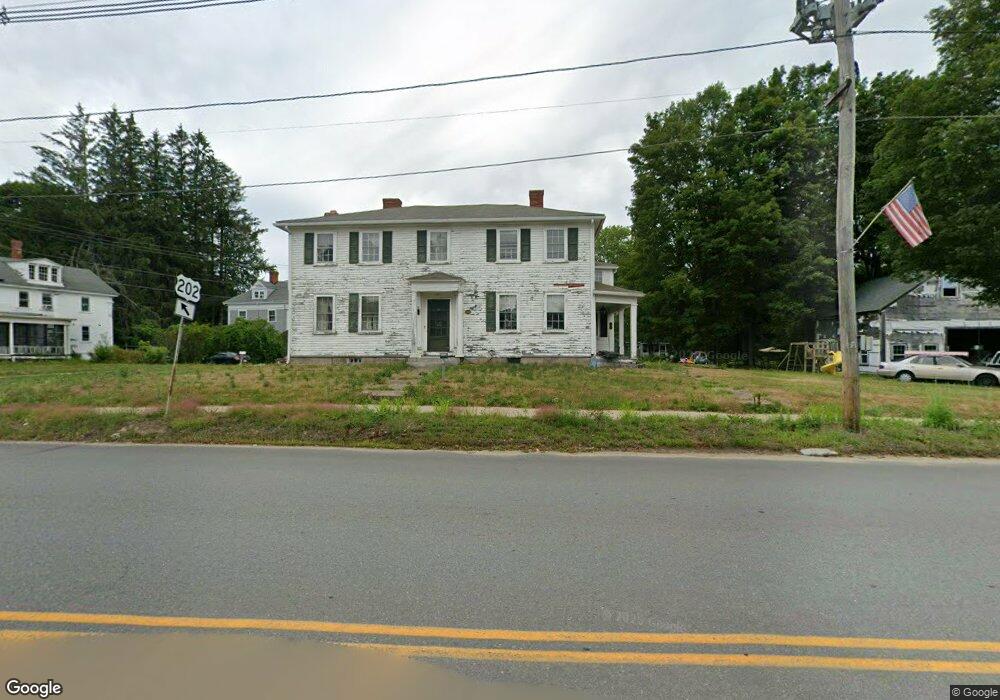
179 Front St Winchendon, MA 01475
Estimated Value: $338,000 - $570,000
7
Beds
5
Baths
4,234
Sq Ft
$113/Sq Ft
Est. Value
About This Home
This home is located at 179 Front St, Winchendon, MA 01475 and is currently estimated at $476,782, approximately $112 per square foot. 179 Front St is a home located in Worcester County with nearby schools including Toy Town Elementary School, Memorial, and The Winchendon School.
Ownership History
Date
Name
Owned For
Owner Type
Purchase Details
Closed on
Nov 17, 2004
Sold by
Almeder Christina E and Almeder George L
Bought by
Keefe Laurie and Cardarelli Mark D
Current Estimated Value
Home Financials for this Owner
Home Financials are based on the most recent Mortgage that was taken out on this home.
Original Mortgage
$90,000
Outstanding Balance
$44,036
Interest Rate
5.8%
Mortgage Type
Purchase Money Mortgage
Estimated Equity
$432,746
Purchase Details
Closed on
Jun 26, 2003
Sold by
Emmons David R
Bought by
Almeder Christina E and Almeder George L
Purchase Details
Closed on
Jun 23, 2000
Sold by
Kuchinos Michael D and Jackson Jill E
Bought by
Emmons David R
Purchase Details
Closed on
Aug 31, 1988
Sold by
Sweeney Keith E
Bought by
Kuchinos Michael D
Create a Home Valuation Report for This Property
The Home Valuation Report is an in-depth analysis detailing your home's value as well as a comparison with similar homes in the area
Home Values in the Area
Average Home Value in this Area
Purchase History
| Date | Buyer | Sale Price | Title Company |
|---|---|---|---|
| Keefe Laurie | $299,900 | -- | |
| Keefe Laurie | $299,900 | -- | |
| Almeder Christina E | $195,000 | -- | |
| Almeder Christina E | $195,000 | -- | |
| Emmons David R | $173,500 | -- | |
| Emmons David R | $173,500 | -- | |
| Kuchinos Michael D | $175,000 | -- |
Source: Public Records
Mortgage History
| Date | Status | Borrower | Loan Amount |
|---|---|---|---|
| Open | Keefe Laurie | $90,000 | |
| Closed | Kuchinos Michael D | $90,000 | |
| Previous Owner | Kuchinos Michael D | $45,000 |
Source: Public Records
Tax History
| Year | Tax Paid | Tax Assessment Tax Assessment Total Assessment is a certain percentage of the fair market value that is determined by local assessors to be the total taxable value of land and additions on the property. | Land | Improvement |
|---|---|---|---|---|
| 2025 | $5,091 | $433,300 | $38,500 | $394,800 |
| 2024 | $4,983 | $397,400 | $35,000 | $362,400 |
| 2023 | $4,434 | $330,900 | $33,200 | $297,700 |
| 2022 | $4,890 | $323,600 | $42,700 | $280,900 |
| 2021 | $4,953 | $315,100 | $37,400 | $277,700 |
| 2020 | $5,102 | $313,400 | $35,700 | $277,700 |
| 2019 | $4,881 | $292,100 | $33,200 | $258,900 |
| 2018 | $4,582 | $264,100 | $30,800 | $233,300 |
| 2017 | $4,616 | $256,900 | $33,000 | $223,900 |
| 2016 | $4,382 | $251,400 | $31,400 | $220,000 |
| 2015 | $4,188 | $250,500 | $31,400 | $219,100 |
| 2014 | $3,968 | $248,600 | $34,000 | $214,600 |
Source: Public Records
Map
Nearby Homes
Your Personal Tour Guide
Ask me questions while you tour the home.