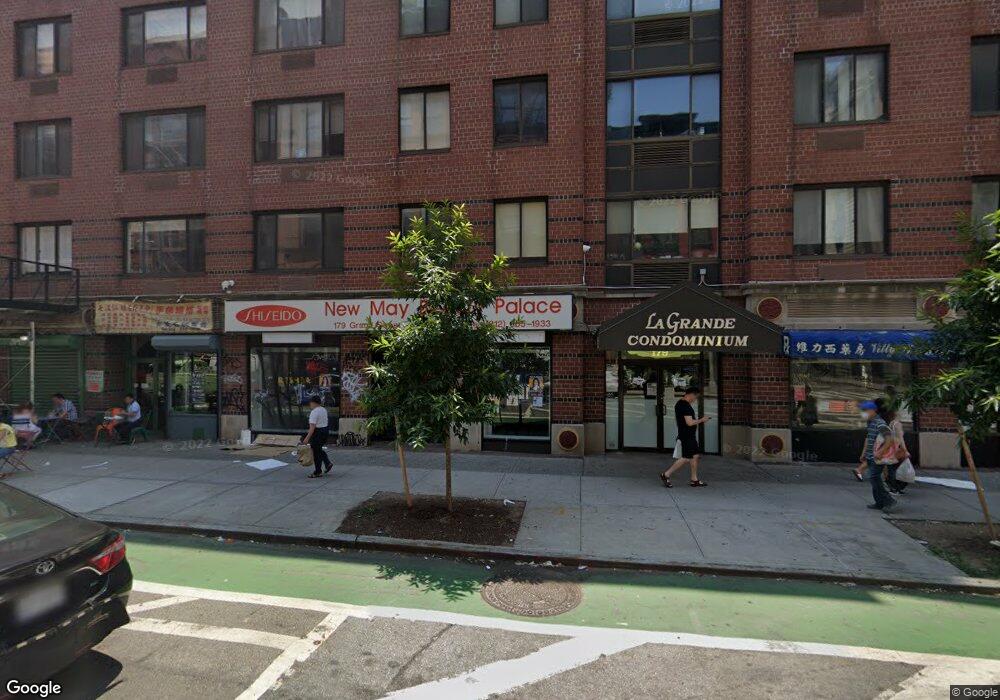
179 Grand St Unit 6F New York, NY 10013
Estimated Value: $977,000 - $1,376,000
--
Bed
--
Bath
837
Sq Ft
$1,348/Sq Ft
Est. Value
About This Home
This home is located at 179 Grand St Unit 6F, New York, NY 10013 and is currently estimated at $1,127,953, approximately $1,347 per square foot. 179 Grand St Unit 6F is a home located in New York County with nearby schools including P.S. 130 - Hernando De Soto, M.S. 131 Dr. Sun Yat Sen, and Clinton School.
Ownership History
Date
Name
Owned For
Owner Type
Purchase Details
Closed on
Feb 16, 2021
Sold by
Chan Herbert K
Bought by
Chan Herbert K and Hu Fangli T
Current Estimated Value
Home Financials for this Owner
Home Financials are based on the most recent Mortgage that was taken out on this home.
Original Mortgage
$548,250
Outstanding Balance
$490,349
Interest Rate
2.7%
Mortgage Type
Purchase Money Mortgage
Estimated Equity
$637,604
Purchase Details
Closed on
Jan 14, 2013
Sold by
Cheung Kwai Ching
Bought by
Chan Herbert K
Home Financials for this Owner
Home Financials are based on the most recent Mortgage that was taken out on this home.
Original Mortgage
$520,000
Interest Rate
3.41%
Mortgage Type
New Conventional
Purchase Details
Closed on
Feb 11, 2003
Sold by
Au-Yeung Ka Kue and Au-Yeung Yu Tung
Bought by
Au-Yeung Yu Tung and Chan Belinda Yuk
Purchase Details
Closed on
Aug 3, 1994
Sold by
179 Grand Corp
Bought by
Au Yeung Ka Kue and Au Yeung Yu Tung
Create a Home Valuation Report for This Property
The Home Valuation Report is an in-depth analysis detailing your home's value as well as a comparison with similar homes in the area
Home Values in the Area
Average Home Value in this Area
Purchase History
| Date | Buyer | Sale Price | Title Company |
|---|---|---|---|
| Chan Herbert K | -- | -- | |
| Chan Herbert K | -- | -- | |
| Chan Herbert K | $720,000 | -- | |
| Chan Herbert K | $720,000 | -- | |
| Au-Yeung Yu Tung | -- | -- | |
| Au-Yeung Yu Tung | -- | -- | |
| Au Yeung Ka Kue | -- | -- | |
| Au Yeung Ka Kue | -- | -- |
Source: Public Records
Mortgage History
| Date | Status | Borrower | Loan Amount |
|---|---|---|---|
| Open | Chan Herbert K | $548,250 | |
| Closed | Chan Herbert K | $548,250 | |
| Closed | Chan Herbert K | $520,000 | |
| Closed | Au-Yeung Yu Tung | $0 |
Source: Public Records
Tax History Compared to Growth
Tax History
| Year | Tax Paid | Tax Assessment Tax Assessment Total Assessment is a certain percentage of the fair market value that is determined by local assessors to be the total taxable value of land and additions on the property. | Land | Improvement |
|---|---|---|---|---|
| 2025 | $10,742 | $86,812 | $16,650 | $70,162 |
| 2024 | $10,742 | $85,926 | $16,650 | $69,276 |
| 2023 | $10,420 | $84,940 | $16,650 | $68,290 |
| 2022 | $9,817 | $80,237 | $16,650 | $63,587 |
| 2021 | $9,792 | $80,235 | $16,650 | $63,585 |
| 2020 | $9,679 | $88,833 | $16,650 | $72,183 |
| 2019 | $9,176 | $86,835 | $16,650 | $70,185 |
| 2018 | $8,737 | $83,801 | $16,650 | $67,151 |
| 2017 | $8,058 | $66,109 | $16,650 | $49,459 |
| 2016 | $7,862 | $69,128 | $16,650 | $52,478 |
| 2015 | $4,827 | $64,631 | $16,650 | $47,981 |
| 2014 | $4,827 | $59,804 | $16,650 | $43,154 |
Source: Public Records
Map
Nearby Homes
- 185 Grand St Unit 6 C
- 185 Grand St Unit 2B
- 133 Mulberry St Unit 4C
- 240 Centre St Unit 2K
- 240 Centre St Unit 3J
- 240 Centre St Unit 3-B
- 141 Grand St
- 123 Baxter St Unit PHB
- 129 Lafayette St Unit 8C
- 30 Crosby St Unit 4B
- 30 Crosby St Unit 4A
- 39 1/2 Crosby St Unit 4
- 430 Broome St Unit 4
- 210 Lafayette St Unit 7D
- 210 Lafayette St Unit 2E
- 210 Lafayette St Unit 5B
- 210 Lafayette St Unit 3D
- 210 Lafayette St Unit 4B
- 210 Lafayette St Unit 3A
- 210 Lafayette St Unit 2D
- 179 Grand St Unit 3F
- 179 Grand St Unit 2C
- 179 Grand St Unit 7D
- 179 Grand St Unit 7C
- 179 Grand St Unit 7B
- 179 Grand St Unit 7A
- 179 Grand St Unit 6G
- 179 Grand St Unit 6E
- 179 Grand St Unit 6D
- 179 Grand St Unit 6C
- 179 Grand St Unit 6B
- 179 Grand St Unit 6A
- 179 Grand St Unit 5G
- 179 Grand St Unit 5F
- 179 Grand St Unit 5E
- 179 Grand St Unit 5D
- 179 Grand St Unit 5C
- 179 Grand St Unit 5B
- 179 Grand St Unit 5A
- 179 Grand St Unit 4G