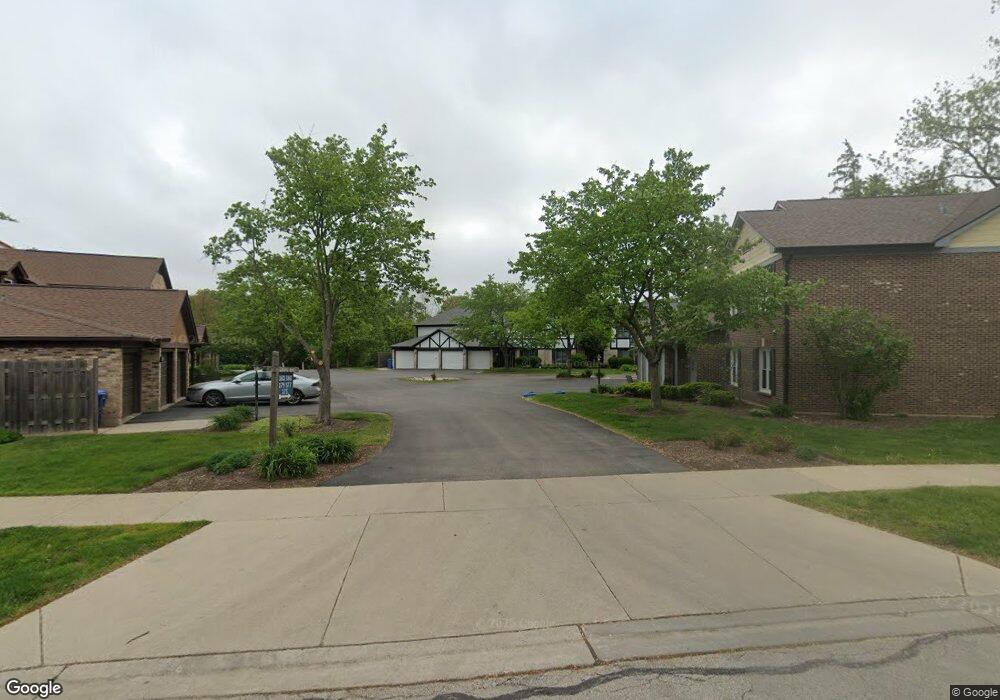
179 Grove Ave Unit 221A Des Plaines, IL 60016
Estimated Value: $267,000 - $277,379
3
Beds
1
Bath
14,218
Sq Ft
$19/Sq Ft
Est. Value
About This Home
This home is located at 179 Grove Ave Unit 221A, Des Plaines, IL 60016 and is currently estimated at $272,095, approximately $19 per square foot. 179 Grove Ave Unit 221A is a home located in Cook County with nearby schools including North Elementary School, Chippewa Middle School, and Maine West High School.
Ownership History
Date
Name
Owned For
Owner Type
Purchase Details
Closed on
Feb 4, 2020
Sold by
Mcmahon Christopher A and Estate Of Elizabeth Mcmahon
Bought by
Vicki Gursoy
Current Estimated Value
Home Financials for this Owner
Home Financials are based on the most recent Mortgage that was taken out on this home.
Original Mortgage
$131,250
Outstanding Balance
$116,477
Interest Rate
3.72%
Mortgage Type
New Conventional
Estimated Equity
$155,618
Purchase Details
Closed on
Feb 17, 2000
Sold by
Feldman Larry A
Bought by
Feldman Larry A and Temchuk Barbara A
Purchase Details
Closed on
Jul 19, 1999
Sold by
Schemmel Dale A and Schemmel Karen C
Bought by
Feldman Larry A
Home Financials for this Owner
Home Financials are based on the most recent Mortgage that was taken out on this home.
Original Mortgage
$112,400
Interest Rate
7.54%
Create a Home Valuation Report for This Property
The Home Valuation Report is an in-depth analysis detailing your home's value as well as a comparison with similar homes in the area
Home Values in the Area
Average Home Value in this Area
Purchase History
| Date | Buyer | Sale Price | Title Company |
|---|---|---|---|
| Vicki Gursoy | $175,000 | Attorney | |
| Feldman Larry A | -- | -- | |
| Feldman Larry A | $140,500 | -- |
Source: Public Records
Mortgage History
| Date | Status | Borrower | Loan Amount |
|---|---|---|---|
| Open | Vicki Gursoy | $131,250 | |
| Previous Owner | Feldman Larry A | $112,400 |
Source: Public Records
Tax History Compared to Growth
Tax History
| Year | Tax Paid | Tax Assessment Tax Assessment Total Assessment is a certain percentage of the fair market value that is determined by local assessors to be the total taxable value of land and additions on the property. | Land | Improvement |
|---|---|---|---|---|
| 2024 | $3,799 | $17,726 | $3,197 | $14,529 |
| 2023 | $4,561 | $17,726 | $3,197 | $14,529 |
| 2022 | $4,561 | $17,726 | $3,197 | $14,529 |
| 2021 | $3,566 | $11,601 | $3,882 | $7,719 |
| 2020 | $2,568 | $11,601 | $3,882 | $7,719 |
| 2019 | $2,579 | $13,012 | $3,882 | $9,130 |
| 2018 | $2,100 | $10,456 | $3,425 | $7,031 |
| 2017 | $2,080 | $10,456 | $3,425 | $7,031 |
| 2016 | $2,212 | $10,456 | $3,425 | $7,031 |
| 2015 | $2,188 | $9,862 | $2,968 | $6,894 |
| 2014 | $2,158 | $9,862 | $2,968 | $6,894 |
| 2013 | $2,087 | $9,862 | $2,968 | $6,894 |
Source: Public Records
Map
Nearby Homes
- 1578 Woodland Ave Unit D
- 1433 Willow Ave
- 430 Oak St
- 365 Graceland Ave Unit 205A
- 185 Eli Ct
- 184 Lilah Ct
- 182 Lilah Ct
- 182 Eli Ct
- 394 Alles St Unit 3B
- 395 Graceland Ave Unit 207
- 476 Alles St Unit 508
- 476 Alles St Unit 210
- 555 S River Rd Unit 301
- 501 Alles St Unit 501A
- 1470 Jefferson St Unit 504
- 1470 Jefferson St Unit 405
- 550 Ida St Unit 2NW
- 1279 Harding Ave Unit 3B
- 1279 Harding Ave Unit 2B
- 85 Bender Rd
- 179 Grove Ave Unit D
- 179 Grove Ave Unit 221B
- 179 Grove Ave Unit 222D
- 179 Grove Ave Unit 222C
- 179 Grove Ave Unit 2C
- 179 Grove Ave Unit A
- 181 Grove Ave Unit 232C
- 181 Grove Ave Unit 232D
- 181 Grove Ave Unit 231B
- 181 Grove Ave Unit 231A
- 181 Grove Ave Unit D
- 181 Grove Ave Unit A
- 181 Grove Ave Unit B
- 177 Grove Ave Unit 212C
- 177 Grove Ave Unit 211A
- 177 Grove Ave Unit 212D
- 177 Grove Ave Unit 211B
- 177 Grove Ave Unit A
- 177 Grove Ave Unit D
- 183 Grove Ave Unit 241B